File:COVID-19 Outbreak World Map Total Deaths per Capita.svg

此SVG文件的PNG预览的大小:800 × 406像素。 其他分辨率:320 × 162像素 | 640 × 325像素 | 1,024 × 520像素 | 1,280 × 650像素 | 2,560 × 1,300像素 | 2,754 × 1,398像素。
原始文件 (SVG文件,尺寸为2,754 × 1,398像素,文件大小:1.24 MB)

|
This file may be updated to reflect new information. If you wish to use a specific version of the file without new updates being mirrored, please upload the required version as a separate file. |
摘要
| 描述 |
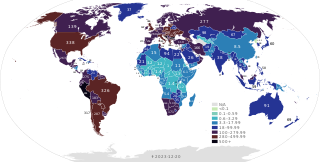
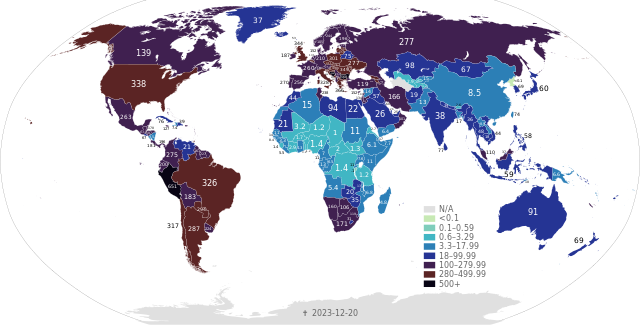
English: COVID-19 Outbreak World Map Total Reported Deaths per Capita.
500+ deaths per 100,000 inhabitants
280-499.99
100–279.99
18–99.99
3.3–17.99
0.6–3.29
0.1–0.59
<0.1
No deaths or no data
Data is from the deaths per million column at Template:COVID-19 pandemic death rates (or the expanded version here). The data is also found here. Data is converted from deaths per million to deaths per 100,000. Can be double checked against statista.com and realclearpolitics.com |
| 日期 | - Date of first upload to the Wikimedia Commons. See the file history farther down for the latest date. |
| 来源 |
自己的作品; |
| 作者 | Dan Polansky and authors of File:BlankMap-World.svg. |
| SVG开发 |
许可协议
我,本作品著作权人,特此采用以下许可协议发表本作品:
本文件采用知识共享署名-相同方式共享 4.0 国际许可协议授权。
- 您可以自由地:
- 共享 – 复制、发行并传播本作品
- 修改 – 改编作品
- 惟须遵守下列条件:
- 署名 – 您必须对作品进行署名,提供授权条款的链接,并说明是否对原始内容进行了更改。您可以用任何合理的方式来署名,但不得以任何方式表明许可人认可您或您的使用。
- 相同方式共享 – 如果您再混合、转换或者基于本作品进行创作,您必须以与原先许可协议相同或相兼容的许可协议分发您贡献的作品。
文件历史
点击某个日期/时间查看对应时刻的文件。
| 日期/时间 | 缩略图 | 大小 | 用户 | 备注 | |
|---|---|---|---|---|---|
| 当前 | 2023年12月20日 (三) 21:32 | | 2,754 × 1,398(1.24 MB) | JackintheBox | Updated as of 20 December |
| 2023年5月19日 (五) 22:26 |  | 2,754 × 1,398(1.24 MB) | JackintheBox | Updated with data as of 19 May | |
| 2023年5月7日 (日) 02:38 |  | 2,754 × 1,398(1.18 MB) | Alecnotalex | fixed guatemala 1122 -> 112 | |
| 2023年1月19日 (四) 01:34 |  | 2,754 × 1,398(1.24 MB) | JackintheBox | Updated data as of 18 Jan | |
| 2022年9月22日 (四) 12:41 |  | 2,754 × 1,398(1.24 MB) | JackintheBox | Changed date on map to 20 Sep | |
| 2022年9月20日 (二) 23:49 |  | 2,754 × 1,398(1.24 MB) | JackintheBox | Updated map as of 20 September | |
| 2022年8月18日 (四) 19:50 |  | 2,754 × 1,398(1.24 MB) | JackintheBox | Updated map as of 18 August | |
| 2022年7月15日 (五) 21:40 |  | 2,754 × 1,398(1.24 MB) | JackintheBox | Updated map as of 15 July | |
| 2022年6月25日 (六) 23:11 |  | 2,754 × 1,398(1.24 MB) | Longestview | {{current}} | |
| 2022年6月1日 (三) 20:59 |  | 2,754 × 1,398(1.22 MB) | JackintheBox | Updated shades and values for 1 Jun using Our World in Data |
文件用途
以下3个页面使用本文件:
全域文件用途
以下其他wiki使用此文件:
- ar.wikipedia.org上的用途
- azb.wikipedia.org上的用途
- az.wikipedia.org上的用途
- be.wikipedia.org上的用途
- bg.wikipedia.org上的用途
- bh.wikipedia.org上的用途
- bn.wikipedia.org上的用途
- bs.wikipedia.org上的用途
- bug.wikipedia.org上的用途
- ca.wikipedia.org上的用途
- ceb.wikipedia.org上的用途
- ckb.wikipedia.org上的用途
- cs.wikipedia.org上的用途
- cy.wikipedia.org上的用途
- el.wikipedia.org上的用途
- en.wikipedia.org上的用途
- 2020s in history
- COVID-19 pandemic
- COVID-19 pandemic by country and territory
- Wikipedia talk:WikiProject COVID-19/Archive 1
- Portal:COVID-19
- Wikipedia:WikiProject COVID-19/Case Count Task Force
- Talk:COVID-19 pandemic/Archive 24
- Wikipedia:Reference desk/Archives/Science/2020 May 20
- User:Investigatory/sandbox
- en.wikibooks.org上的用途
- et.wikipedia.org上的用途
- fa.wikipedia.org上的用途
- fr.wikipedia.org上的用途
- gl.wikipedia.org上的用途
- gv.wikipedia.org上的用途
- hif.wikipedia.org上的用途
- hi.wikipedia.org上的用途
- id.wikipedia.org上的用途
- it.wikipedia.org上的用途
- iu.wikipedia.org上的用途
- ja.wikipedia.org上的用途
- kab.wikipedia.org上的用途
- km.wikipedia.org上的用途
- kn.wikipedia.org上的用途
- la.wikipedia.org上的用途
- lt.wikipedia.org上的用途
- lv.wikipedia.org上的用途
- min.wikipedia.org上的用途
- ml.wikipedia.org上的用途
- mni.wikipedia.org上的用途
查看本文件的更多全域用途。