File:Migrant caravan.pdf
此PDF文件的JPG预览的大小:773 × 599像素。 其他分辨率:310 × 240像素 | 619 × 480像素 | 864 × 670像素。
原始文件 (864 × 670像素,文件大小:720 KB,MIME类型:application/pdf)
摘要
| 描述 |
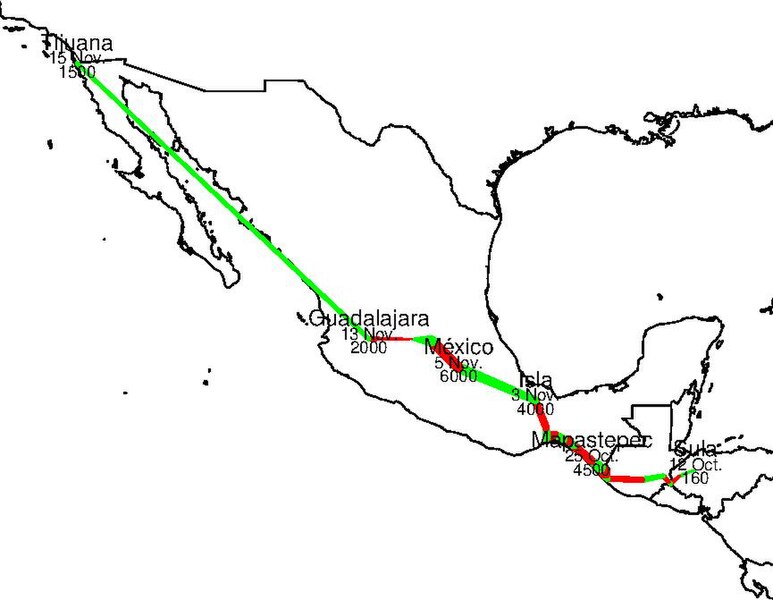
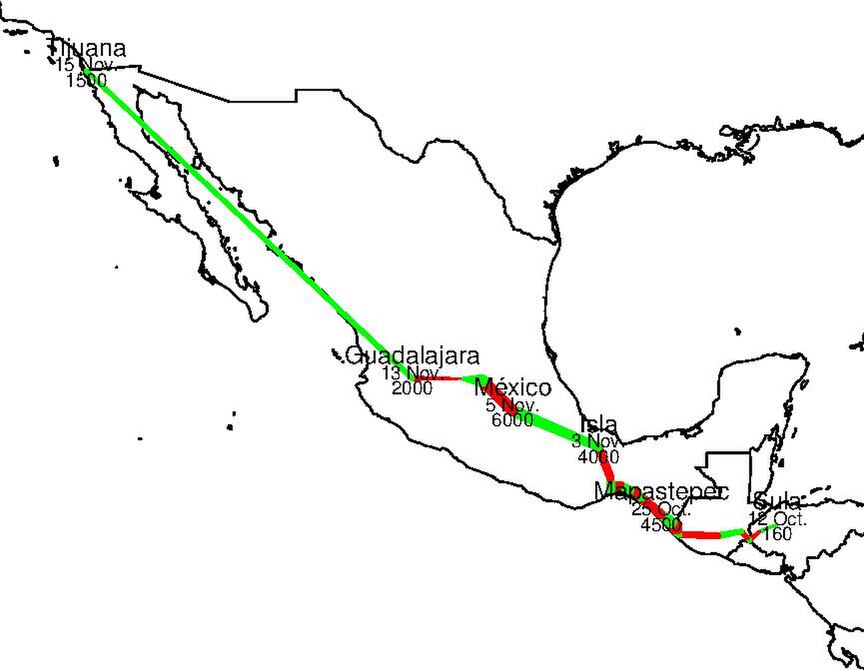
Deutsch: Mittelamerikanische Migrantenkaravane Herbst 2018 Der Weg der Karavane wird entsprechend w:en:Central_American_migrant_caravans#Table nachgezeichnet, wobei die Etappen gemäß Tabelle alternierend gefärbt sind. Nederlands: Centraal-Americaanse migrantencaravaan hervst 2018 English: Central American migrant caravan fall 2018
Feel free to improve the map! Current Code(File karavane.r) #R CMD BATCH karavane.r;pdfcrop migrant_caravan.pdf migrant_caravan.pdf
library(rnaturalearth)
library(plotrix)
liste<-read.table("karavane.tsv",header=TRUE,sep="\t",dec=",")
liste[,1]<-as.Date(liste[,1])
zeck<-.75#Schriftgröße
vek<-c(1,10,17,18,21,22)#Genannte Städte
band<-.95*max(max(liste$Longitude)-min(liste$Longitude),max(liste$Latitude)-min(liste$Latitude))/2#edge length map
mittex<-(max(liste$Longitude)+min(liste$Longitude))/2
mittey<-(max(liste$Latitude)+min(liste$Latitude))/2
map<-ne_countries(continent = "north america",scale=10)#Precise map for publication
#map<-ne_countries(continent = "north america",scale=110)#Small file for testing
farbe<-function(farbe.n){
farbe.f<-"red"
if(farbe.n%%2==0){farbe.f<-"green"}
farbe.f
}#Allow for differen colors per stage
#Plotfunktion:
bild<-function(){if(require(sp)){plot(map,ylim=c(mittey-band,mittey+band),xlim=c(mittex-band,mittex+band))}}#produces the map
marke<-function(tag){
text(liste$Longitude[tag],liste$Latitude[tag],labels=liste$Plak[tag],cex=1,pos=3)#Stadt
text(liste$Longitude[tag],liste$Latitude[tag]-.6,labels=liste$KD[tag],cex=zeck,pos=3)#Datum
text(liste$Longitude[tag],liste$Latitude[tag]-1.2,labels=liste$People[tag],cex=zeck,pos=3)#Stärke
}
dicke<-.00003#stream thickness
punkt<-function(punkt.n,punkt.r){
punkt.p<-c(liste$Longitude[punkt.n],liste$Latitude[punkt.n])
punkt.weg<-c(cos(punkt.r),sin(punkt.r))*dicke*liste$People[punkt.n]
punkt.p+punkt.weg
}
#flow
strich<-function(strich.n){
grund<-c(liste$Longitude[strich.n]-liste$Longitude[strich.n-1],liste$Latitude[strich.n]-liste$Latitude[strich.n-1])
gradient<-atan2(grund[2],grund[1])
länge<-norm(grund,type="2")
tüte<-asin((liste$People[strich.n]-liste$People[strich.n-1])*dicke/länge)
eck<-matrix(c(1:8),4)
eck[1,]<-punkt(strich.n,gradient+tüte+pi/2)
eck[2,]<-punkt(strich.n,gradient-tüte-pi/2)
eck[3,]<-punkt(strich.n-1,gradient-tüte-pi/2)
eck[4,]<-punkt(strich.n-1,gradient+tüte+pi/2)
polygon(eck[,1],eck[,2],col=farbe(strich.n),border=farbe(strich.n))
draw.circle(liste$Longitude[strich.n],liste$Latitude[strich.n],liste$People[strich.n]*dicke,col=farbe(strich.n),border=farbe(strich.n))
draw.circle(liste$Longitude[strich.n-1],liste$Latitude[strich.n-1],liste$People[strich.n-1]*dicke,col=farbe(strich.n),border=farbe(strich.n))
}
#lines()
#strich<-function(strich.n){lines(c(liste$Longitude[strich.n-1],liste$Longitude[strich.n]),c(liste$Latitude[strich.n-1],liste$Latitude[strich.n]),lwd=liste$People[strich.n-1]/1000,col=farbe(strich.n))}
#makes the path
ganz<-function(){
bild()#Plot erstellen
lapply(c(2:dim(liste)[1]),strich)#insert path
lapply(vek,marke)#Marken einfügen
}
#ganz()
pdf("migrant_caravan.pdf")#Outputdatei öffnen
ganz()#Jetzt wird gedruckt
dev.off()#Outputdatei schließen
Current Data(File karavane.tsv, as derived from w:en:Central American migrant caravans#Table) Date KD Place Plak Latitude Longitude People 2018-10-12 12 Oct. San Pedro Sula Sula 15,052018 -88,033333 160 2018-10-13 13 Oct. Santa Rosa de Copan Copan 14,766660 -88,783333 1000 2018-10-14 14 Oct. Ocotepeque Ocotepeque 14,433333 -89,183333 1700 2018-10-15 15 Oct. Aguas Calientes (Honduras) Calientes 14,531281 -89,283139 1600 2018-10-16 16 Oct. Chiquimula Chiquimula 14,783333 -89,533333 2000 2018-10-18 18 Oct. Ciudad de Guatemala Guatemala 14,613333 -90,535278 3000 2018-10-19 19 Oct. Ciudad Tecun Uman Tecun Uman 14,666667 -92,150000 3000 2018-10-21 21 Oct. Tapachula Tapachula 14,900000 -92,266667 7000 2018-10-24 24 Oct. Huixtla Huixtla 15,133333 -92,466667 5800 2018-10-25 25 Oct. Mapastepec Mapastepec 15,427778 -92,898333 4500 2018-10-26 26 Oct. Tonala Tonala 16,100000 -93,750000 4500 2018-10-27 27 Oct. Arriaga Arriaga 16,235000 -93,895556 3500 2018-10-28 28 Oct. Tapanatepec Tapanatepec 16,366667 -94,200000 4000 2018-10-30 30 Oct. Santiago Niltepec Niltepec 16,566667 -94,616667 4000 2018-10-31 31 Oct. Juchitán de Zaragoza Juchitán 16,433333 -95,016667 5000 2018-11-02 2 Nov. Matías Romero Matías Romero 16,866667 -95,033333 4000 2018-11-03 3 Nov. Isla, Veracruz Isla 18,033333 -95,533333 4000 2018-11-05 5 Nov. Ciudad de México México 19,433333 -99,133333 6000 2018-11-10 10 Nov. Santiago de Querétaro Querétaro 20,587500 -100,392778 6531 2018-11-11 11 Nov. Irapuato Irapuato 20,666667 -101,350000 1 2018-11-13 13 Nov. Guadalajara Guadalajara 20,676667 -103,347500 2000 2018-11-15 15 Nov. Tijuana Tijuana 32,525000 -117,033333 1500 |
| 日期 | |
| 来源 | 自己的作品 |
| 作者 | Ciciban |
许可协议
我,本作品著作权人,特此采用以下许可协议发表本作品:
本文件采用知识共享署名-相同方式共享 4.0 国际许可协议授权。
- 您可以自由地:
- 共享 – 复制、发行并传播本作品
- 修改 – 改编作品
- 惟须遵守下列条件:
- 署名 – 您必须对作品进行署名,提供授权条款的链接,并说明是否对原始内容进行了更改。您可以用任何合理的方式来署名,但不得以任何方式表明许可人认可您或您的使用。
- 相同方式共享 – 如果您再混合、转换或者基于本作品进行创作,您必须以与原先许可协议相同或相兼容的许可协议分发您贡献的作品。
文件历史
点击某个日期/时间查看对应时刻的文件。
| 日期/时间 | 缩略图 | 大小 | 用户 | 备注 | |
|---|---|---|---|---|---|
| 当前 | 2018年11月16日 (五) 08:08 |  | 864 × 670(720 KB) | Ciciban | Actualized→Tijuana |
| 2018年11月15日 (四) 15:52 | 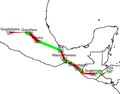 | 864 × 675(777 KB) | Ciciban | Switched to linearly changing thickness | |
| 2018年11月14日 (三) 15:34 | 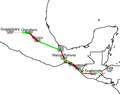 | 864 × 675(768 KB) | Ciciban | Actualized | |
| 2018年11月11日 (日) 11:04 | 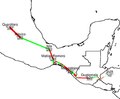 | 864 × 712(783 KB) | Ciciban | Number fixed – currently only 2000 have arrived in Querétaro | |
| 2018年11月11日 (日) 10:49 |  | 864 × 712(783 KB) | Ciciban | Querétaro added | |
| 2018年11月7日 (三) 09:49 | 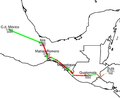 | 864 × 704(792 KB) | Ciciban | *Colors per stage *Mexico City->Autonym (the map should work in other wikis, too) *New crowd size | |
| 2018年11月6日 (二) 12:49 | 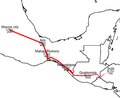 | 864 × 704(792 KB) | Ciciban | Cropped and other issues | |
| 2018年11月6日 (二) 10:10 | 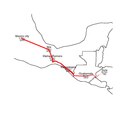 | 1,050 × 1,050(73 KB) | Ciciban | Actualization | |
| 2018年11月4日 (日) 16:00 |  | 1,050 × 1,050(5 KB) | Ciciban | Culprit corrected | |
| 2018年11月4日 (日) 15:54 |  | 1,050 × 1,050(5 KB) | Ciciban | Actualization |
文件用途
以下页面使用本文件:
全域文件用途
以下其他wiki使用此文件:
- en.wikipedia.org上的用途
- fr.wikipedia.org上的用途
- he.wikipedia.org上的用途
- nl.wikinews.org上的用途