File:Bar Chart of Poverty by Age and Gender in Tennessee.svg

此SVG文件的PNG预览的大小:800 × 297像素。 其他分辨率:320 × 119像素 | 640 × 238像素 | 1,024 × 380像素 | 1,280 × 476像素 | 2,560 × 951像素 | 872 × 324像素。
原始文件 (SVG文件,尺寸为872 × 324像素,文件大小:39 KB)
摘要
| 描述 |
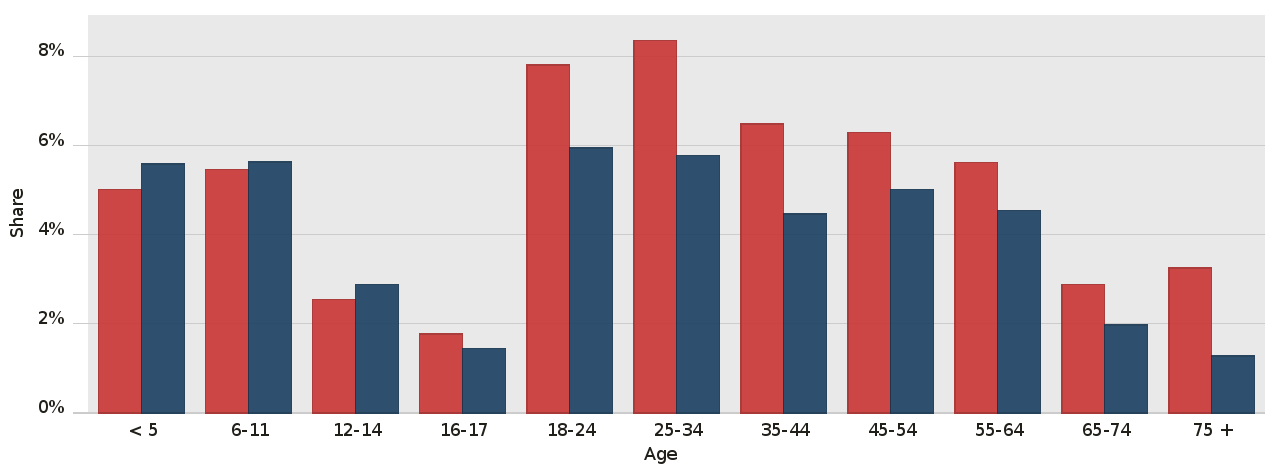
English: 16.7% of the population in Tennessee (6.44M people) live below the poverty line, a number that is higher than the national average of 14.7%. The largest demographic living in poverty is Female 25-34, followed by Female 18-24 and then Female 35-44. The Census Bureau uses a set of money income thresholds that vary by family size and composition to determine who classifies is impoverished. If a family's total income is less than the family's threshold than that family and every individual in it is considered to be living in poverty.
Female
Male |
| 日期 | |
| 来源 |
|
| 作者 | Datawheel |
W3C-validity not checked.
许可协议
|
|
| 本作品采用知识共享CC0 1.0 通用公有领域贡献许可协议授权。 | |
| 采用本宣告发表本作品的人,已在法律允许的范围内,通过在全世界放弃其对本作品拥有的著作权法规定的所有权利(包括所有相关权利),将本作品贡献至公有领域。您可以复制、修改、传播和表演本作品,将其用于商业目的,无需要求授权。
|
文件历史
点击某个日期/时间查看对应时刻的文件。
| 日期/时间 | 缩略图 | 大小 | 用户 | 备注 | |
|---|---|---|---|---|---|
| 当前 | 2017年10月12日 (四) 21:16 | 872 × 324(39 KB) | Kaldari | margins | |
| 2017年10月12日 (四) 20:59 | 867 × 331(39 KB) | Kaldari | Adding x axis label | ||
| 2017年10月12日 (四) 20:06 | 867 × 311(39 KB) | Kaldari | Missed some font-family declarations | ||
| 2017年10月12日 (四) 20:02 | 867 × 311(39 KB) | Kaldari | font-family:sans-serif | ||
| 2017年10月12日 (四) 20:01 | 867 × 311(39 KB) | Kaldari | removing legend | ||
| 2017年10月12日 (四) 18:51 |  | 867 × 400(25 KB) | Kaldari | User created page with UploadWizard |
文件用途
以下页面使用本文件:
全域文件用途
以下其他wiki使用此文件:
- en.wikipedia.org上的用途
- fa.wikipedia.org上的用途
- vi.wikipedia.org上的用途