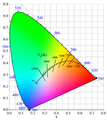
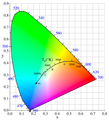
File:PlanckianLocus.png

本预览的尺寸:533 × 599像素。 其他分辨率:213 × 240像素 | 427 × 480像素 | 683 × 768像素 | 910 × 1,024像素 | 1,300 × 1,462像素。
原始文件 (1,300 × 1,462像素,文件大小:461 KB,MIME类型:image/png)
文件历史
点击某个日期/时间查看对应时刻的文件。
| 日期/时间 | 缩略图 | 大小 | 用户 | 备注 | |
|---|---|---|---|---|---|
| 当前 | 2012年1月3日 (二) 13:38 |  | 1,300 × 1,462(461 KB) | PAR~commonswiki | Change degrees K to K |
| 2005年4月16日 (六) 15:51 |  | 1,300 × 1,462(524 KB) | PAR~commonswiki | 1931 CIE xy chromaticity space including the Planckian Locus | |
| 2005年4月14日 (四) 04:59 |  | 1,220 × 1,350(445 KB) | PAR~commonswiki | CIE 1964 chromaticity (xy) diagram showing the Planckian locus. | |
| 2005年4月13日 (三) 05:55 |  | 1,300 × 1,427(472 KB) | PAR~commonswiki | CIE chromaticity diagram including the Planckian Locus of the black body color |
文件用途
全域文件用途
以下其他wiki使用此文件:
- ar.wikipedia.org上的用途
- as.wikipedia.org上的用途
- beta.wikiversity.org上的用途
- bn.wikipedia.org上的用途
- ca.wikipedia.org上的用途
- de.wikipedia.org上的用途
- en.wikipedia.org上的用途
- Color temperature
- Chromaticity
- Black-body radiation
- Planckian locus
- Architectural lighting design
- Golden hour (photography)
- Color correction
- Talk:Neutron star/Archive 2
- Wikipedia:Reference desk/Archives/Science/2010 June 2
- Wikipedia talk:WikiProject Color/Archive 6
- User:Joelton Ivson/Gather lists/24282 – Cinema
- es.wikipedia.org上的用途
- et.wikipedia.org上的用途
- eu.wikipedia.org上的用途
- fa.wikipedia.org上的用途
- fa.wikibooks.org上的用途
- fi.wikipedia.org上的用途
- fr.wikipedia.org上的用途
- fr.wikibooks.org上的用途
- fr.wikiversity.org上的用途
- fr.wiktionary.org上的用途
- gl.wikipedia.org上的用途
查看本文件的更多全域用途。

