File:UK popular vote.svg

此SVG文件的PNG预览的大小:800 × 398像素。 其他分辨率:320 × 159像素 | 640 × 318像素 | 1,024 × 509像素 | 1,280 × 636像素 | 2,560 × 1,272像素 | 1,000 × 497像素。
原始文件 (SVG文件,尺寸为1,000 × 497像素,文件大小:15 KB)
摘要
| 描述 |
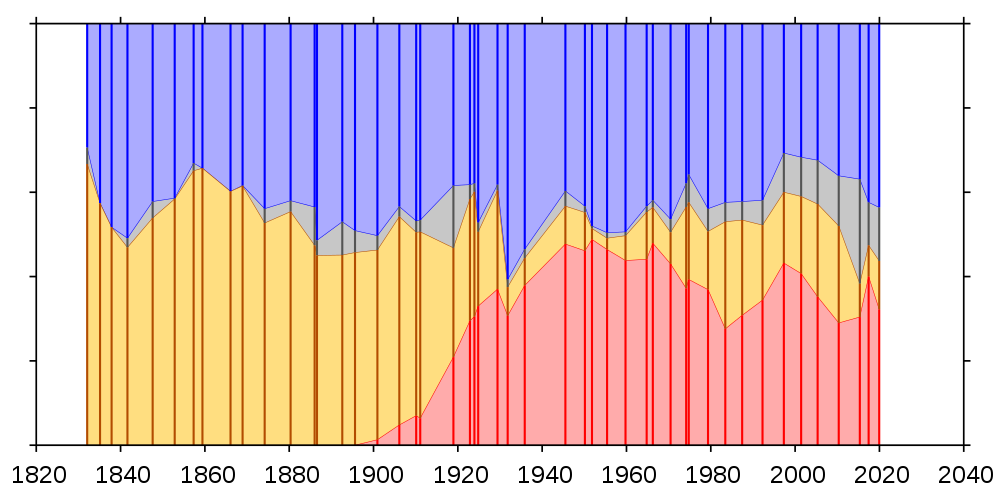
English: Shares of the popular vote obtained by the largest parties in UK general elections since 1832.
A graphical representation of figures in
Key (from top to bottom): Tory (1832), Conservative (from 1835), Liberal Conservative (1847–59), Liberal Unionist (1886–1910), National parties (1931–45)
other parties and independents
Whig (to mid-19th century), Liberal (mid-19th century to 1979), National Liberal (1922), Independent Liberal (1931), SDP–Liberal Alliance (1983–87) and Liberal Democrat (from 1992)
|
| 日期 | |
| 来源 | 自己的作品 |
| 作者 | Kanguole |
许可协议
我,本作品著作权人,特此采用以下许可协议发表本作品:
本文件采用知识共享署名-相同方式共享 3.0 未本地化版本许可协议授权。
- 您可以自由地:
- 共享 – 复制、发行并传播本作品
- 修改 – 改编作品
- 惟须遵守下列条件:
- 署名 – 您必须对作品进行署名,提供授权条款的链接,并说明是否对原始内容进行了更改。您可以用任何合理的方式来署名,但不得以任何方式表明许可人认可您或您的使用。
- 相同方式共享 – 如果您再混合、转换或者基于本作品进行创作,您必须以与原先许可协议相同或相兼容的许可协议分发您贡献的作品。

|
已授权您依据自由软件基金会发行的无固定段落及封面封底文字(Invariant Sections, Front-Cover Texts, and Back-Cover Texts)的GNU自由文件许可协议1.2版或任意后续版本的条款,复制、传播和/或修改本文件。该协议的副本请见“GNU Free Documentation License”。 |
您可以选择您需要的许可协议。
文件历史
点击某个日期/时间查看对应时刻的文件。
| 日期/时间 | 缩略图 | 大小 | 用户 | 备注 | |
|---|---|---|---|---|---|
| 当前 | 2024年7月5日 (五) 10:51 | | 1,000 × 497(15 KB) | Kanguole | 2024 results (2 constituencies to go, but unlikely to change) |
| 2019年12月13日 (五) 14:34 |  | 1,000 × 497(15 KB) | Kanguole | update for 2019 election | |
| 2017年6月9日 (五) 10:59 |  | 1,000 × 543(14 KB) | Kanguole | include 2017 results | |
| 2015年5月8日 (五) 14:38 |  | 1,000 × 543(14 KB) | Kanguole | include 2015 result | |
| 2010年5月9日 (日) 11:28 |  | 1,000 × 543(14 KB) | Kanguole | simplify source | |
| 2010年5月8日 (六) 13:17 |  | 880 × 470(32 KB) | Kanguole | reduce height | |
| 2010年5月8日 (六) 11:43 |  | 880 × 670(32 KB) | Kanguole | larger numerals | |
| 2010年5月8日 (六) 00:17 |  | 880 × 670(32 KB) | Kanguole | balance lightness | |
| 2010年5月7日 (五) 23:50 |  | 880 × 670(32 KB) | Kanguole | {{Information |Description={{en|1=Shares of the popular vote obtained by the largest parties in UK general elections since 1832. A graphical representation of the figures in Table 2.01 "Summary Results of General Elections 1832-2005 (UK)" from p. 59 of '' |
文件用途
以下页面使用本文件:
全域文件用途
以下其他wiki使用此文件:
- cy.wikipedia.org上的用途
- de.wikipedia.org上的用途
- en.wikipedia.org上的用途
- es.wikipedia.org上的用途
- hu.wikipedia.org上的用途
- pt.wikipedia.org上的用途
- ro.wikipedia.org上的用途
- ru.wikipedia.org上的用途
- th.wikipedia.org上的用途