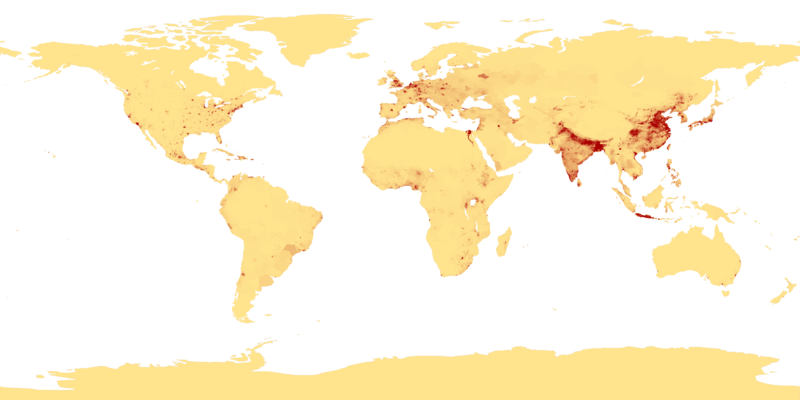
File:Population density.png

本预览的尺寸:800 × 400像素。 其他分辨率:320 × 160像素 | 640 × 320像素 | 1,024 × 512像素 | 1,280 × 640像素 | 2,560 × 1,280像素 | 4,320 × 2,160像素。
原始文件 (4,320 × 2,160像素,文件大小:522 KB,MIME类型:image/png)
文件历史
点击某个日期/时间查看对应时刻的文件。
| 日期/时间 | 缩略图 | 大小 | 用户 | 备注 | |
|---|---|---|---|---|---|
| 当前 | 2013年4月11日 (四) 00:41 |  | 4,320 × 2,160(522 KB) | Jahoe | Re-downloaded original from http://eoimages.gsfc.nasa.gov/images/imagerecords/53000/53005/population_density.tif, re-converted to PNG (preserving alpha channel) using tiff2png (by Willem van Schaik and Greg Roelofs). Removed rgb pixel values from fully... |
| 2007年2月27日 (二) 03:41 |  | 4,320 × 2,160(915 KB) | Keenan Pepper | This image shows the number of people per square kilometer around the world in 1994. The data were derived from population records based on political divisions such as states, provinces, and counties. The image was taken from [http://visibleearth.nasa.go |
文件用途
以下页面使用本文件:
全域文件用途
以下其他wiki使用此文件:
- als.wikipedia.org上的用途
- an.wikipedia.org上的用途
- ar.wikipedia.org上的用途
- ast.wikipedia.org上的用途
- az.wikipedia.org上的用途
- be-tarask.wikipedia.org上的用途
- be.wikipedia.org上的用途
- bg.wikipedia.org上的用途
- bh.wikipedia.org上的用途
- bn.wikipedia.org上的用途
- bs.wikipedia.org上的用途
- ca.wikipedia.org上的用途
- ce.wikipedia.org上的用途
- ckb.wikipedia.org上的用途
- cu.wikipedia.org上的用途
- cv.wikipedia.org上的用途
- da.wikipedia.org上的用途
- da.wikibooks.org上的用途
- de.wikipedia.org上的用途
- dsb.wikipedia.org上的用途
- el.wikipedia.org上的用途
- en.wikipedia.org上的用途
- en.wikiquote.org上的用途
- eo.wikipedia.org上的用途
- es.wikipedia.org上的用途
查看此文件的更多全域用途。


