File:Default-network-graph-maturation.jpeg
原始檔案 (3,006 × 2,827 像素,檔案大小:588 KB,MIME 類型:image/jpeg)
| 描述 |
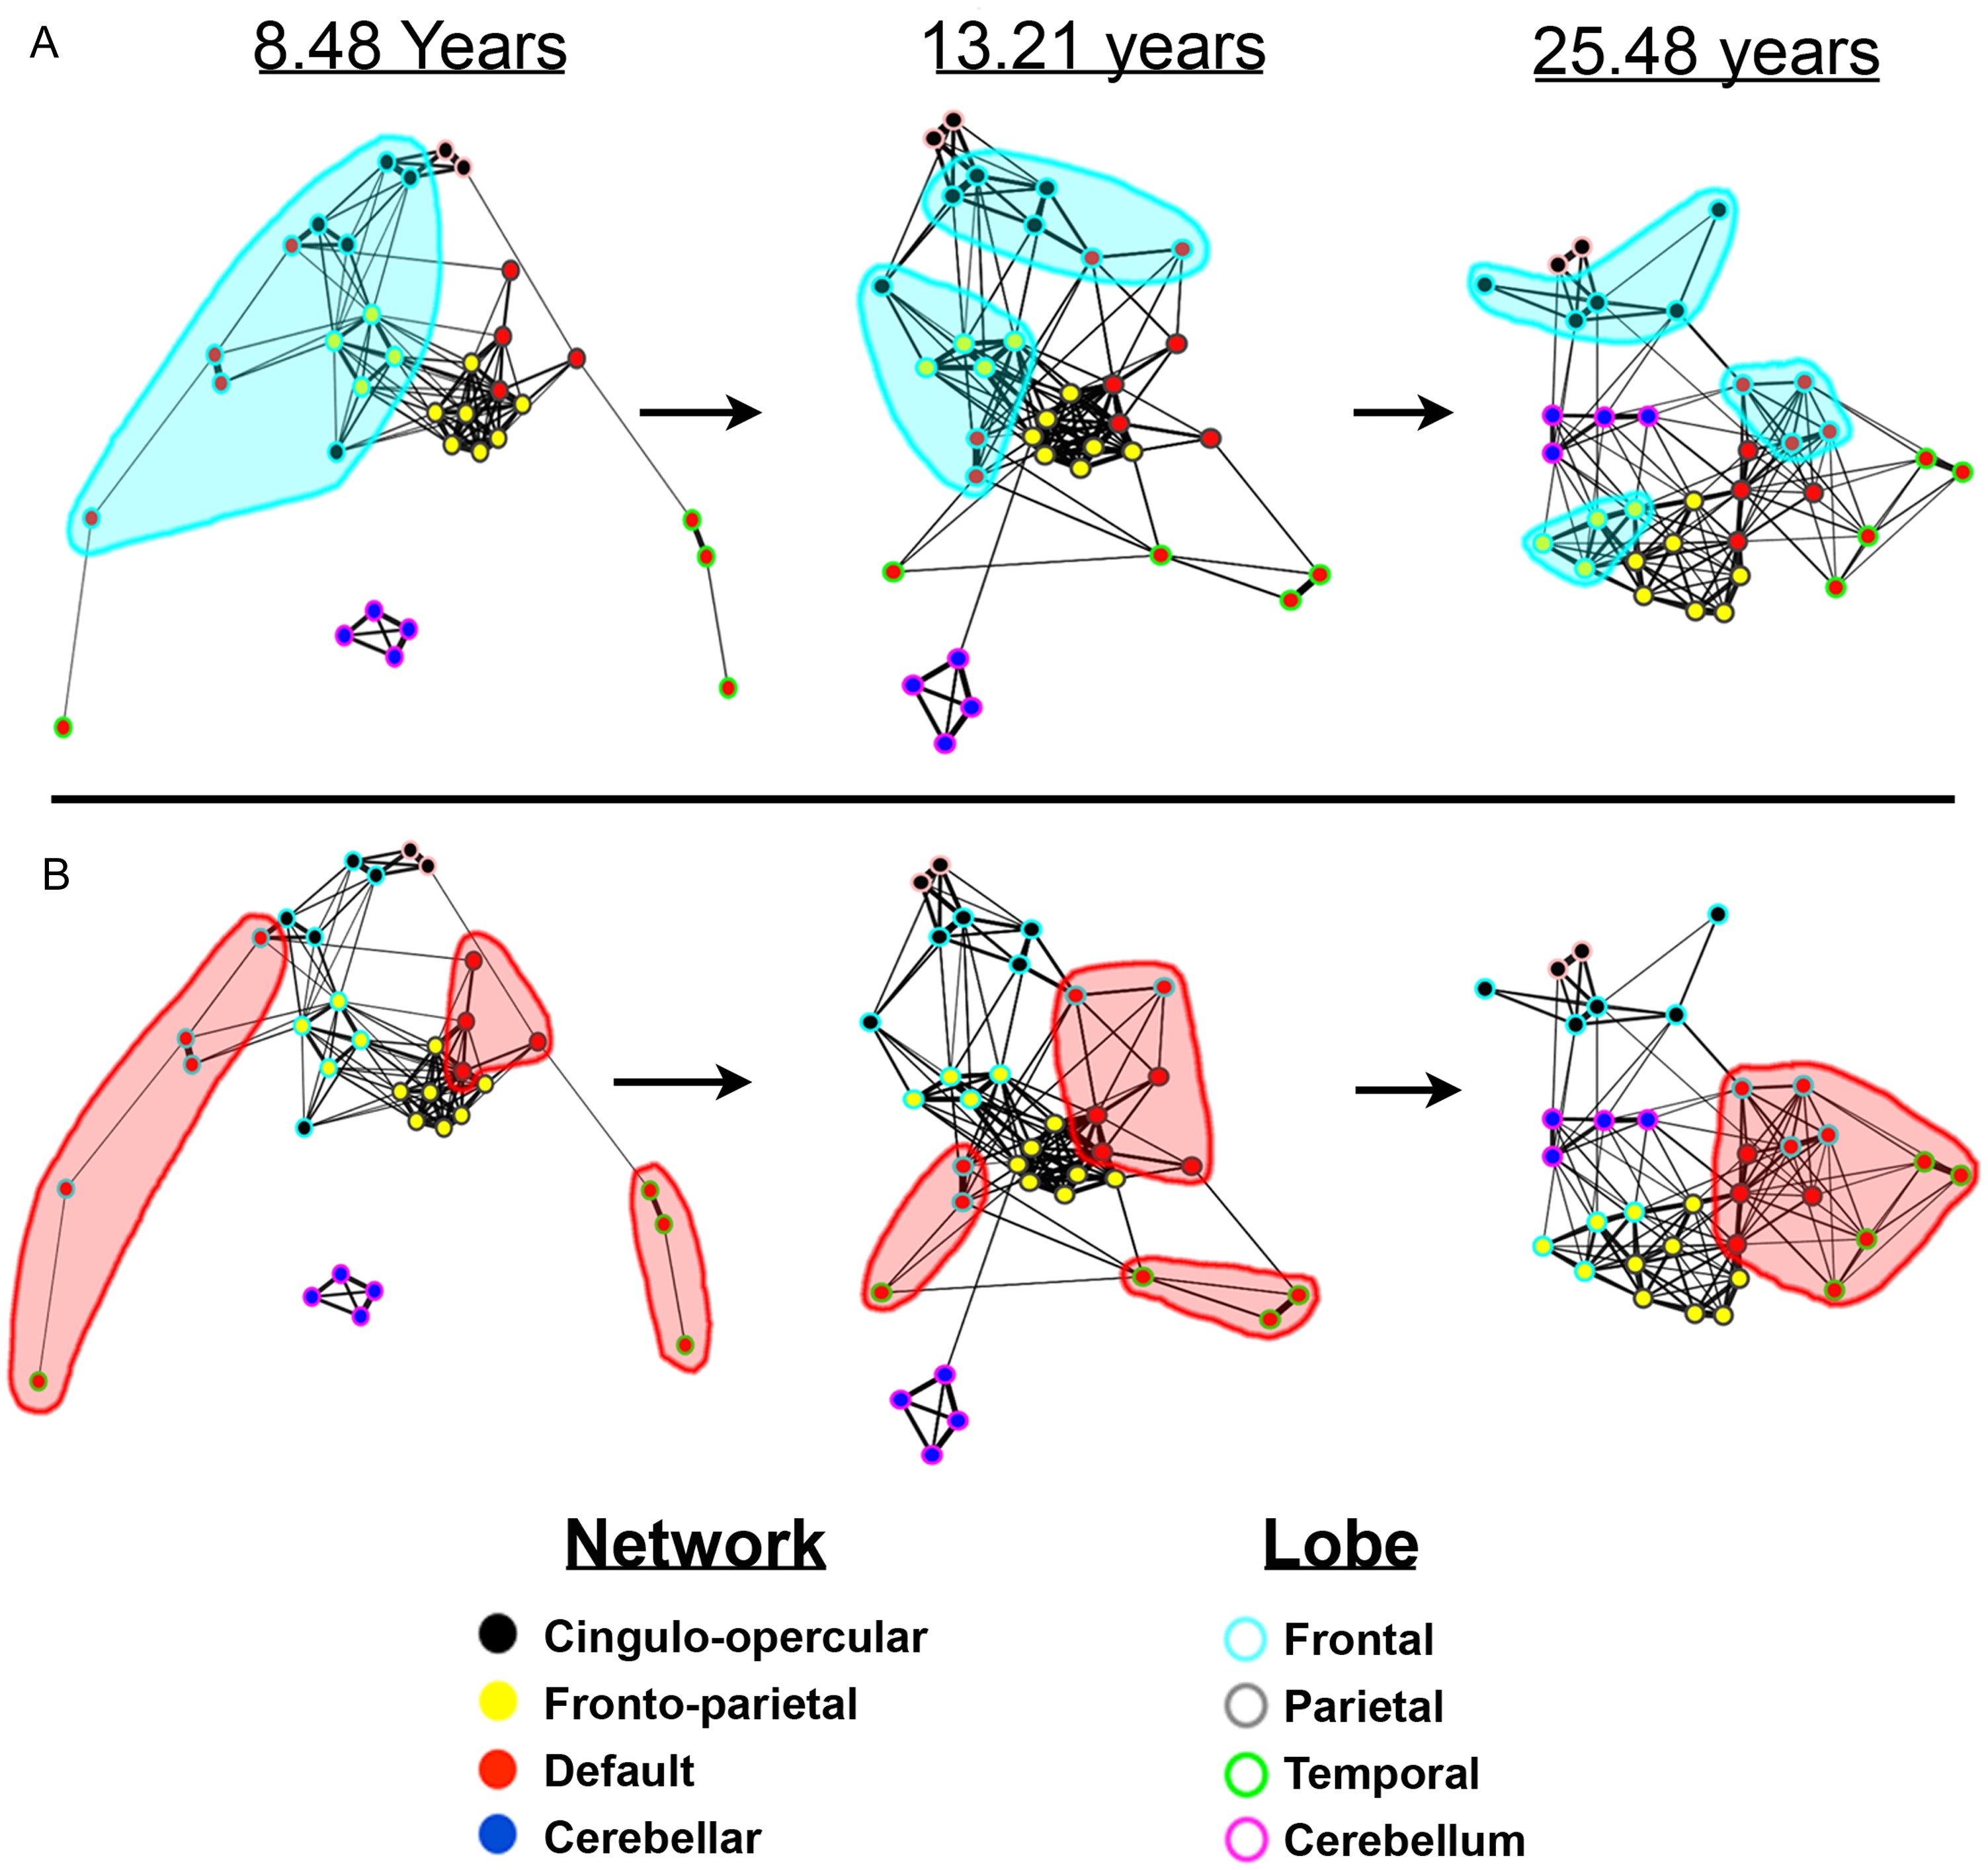
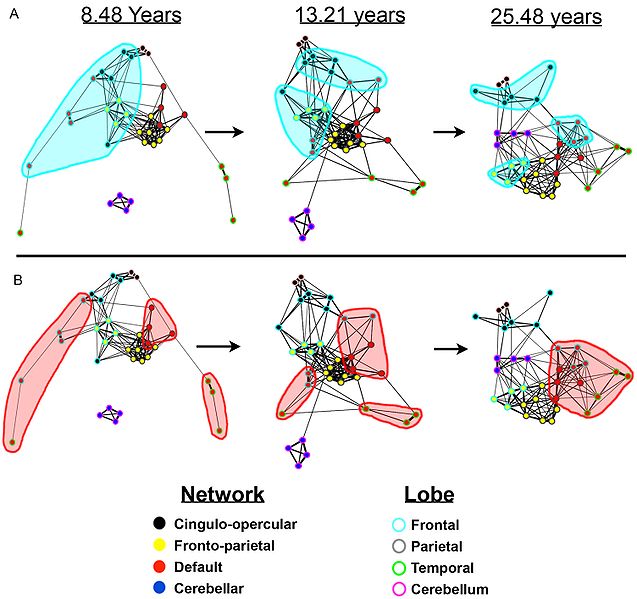
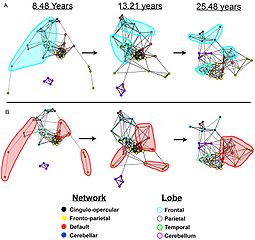
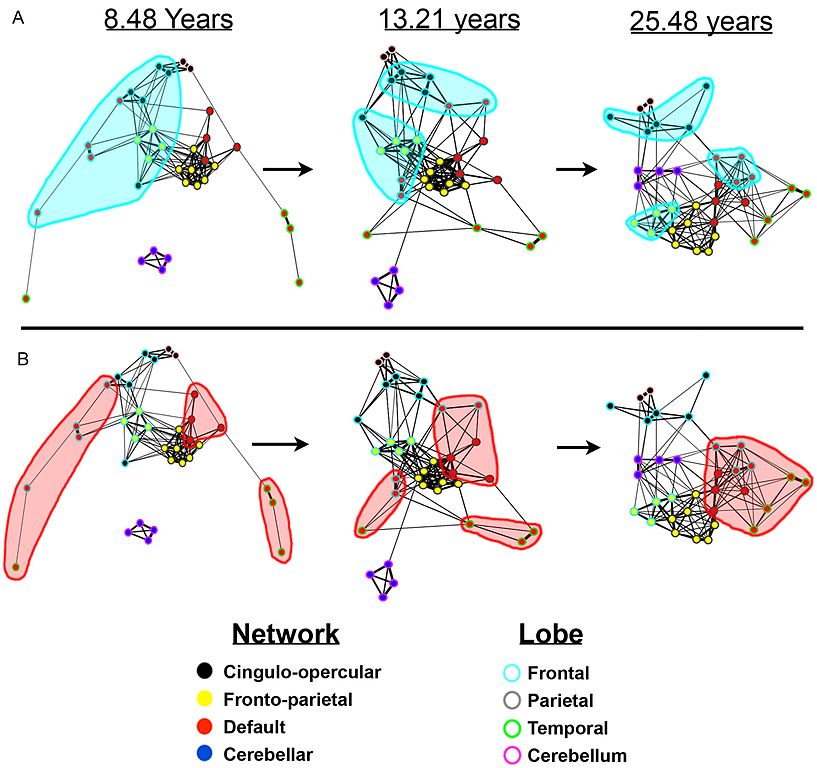
"Over age the graph architecture matures from a “local” organization to a “distributed” organization. In this figure we show the dynamic development and interaction of positive correlations between the two task control networks, the default network, and cerebellar network using spring embedding. The figure highlights the segregation of local, anatomically clustered regions and the integration of functional networks over development. A and B represent individual screen shots (at average ages 8.48, 13.21, and 25.48 years) of dynamic movies (Video S1) of the transition in the network architecture from child to adult ages. Nodes are color coded by their adult network profile (core of the nodes) and also by their anatomical location (node outlines). Black – cingulo-opercular network; Yellow – fronto-parietal network; Red – default network; Blue – cerebellar network; Light blue – frontal cortex; Grey – parietal cortex; Green - temporal cortex, Pink – cerebellum, Light pink – thalamus. Connections with r≥0.1 were considered connected. (A) In children regions are largely organized by their anatomical location, but over age anatomically clustered regions segregate. The cluster of frontal regions (highlighted in light blue) best demonstrates this segregation. (B) In children the more distributed adult functional networks are in many ways disconnected. Over development the functional networks integrate. The isolated regions of the default mode network in childhood (highlighted in light red) that coalesce into a highly correlated network best illustrate this integration. Over age node organization shifts from the “local” arrangement in children to the “distributed” organization commonly observed in adults." (The preceding description is quoted from the source.) |
| 日期 | |
| 來源 | Figure 2 (doi:10.1371/journal.pcbi.1000381.g002) of: Fair DA, Cohen AL, Power JD et al. (2009). "Functional brain networks develop from a 'local to distributed' organization". PLoS Comput Biol 5 (5): e1000381. DOI:10.1371/journal.pcbi.1000381. PMID 19412534. PMC: 2671306. |
| 作者 | Damien A. Fair, Alexander L. Cohen, Jonathan D. Power, Bradley L. Schlaggar, Steven E. Petersen |
| 授權許可 (重用此檔案) |
CC-BY-2.5 [1] |
- 您可以自由:
- 分享 – 複製、發佈和傳播本作品
- 重新修改 – 創作演繹作品
- 惟需遵照下列條件:
- 姓名標示 – 您必須指名出正確的製作者,和提供授權條款的連結,以及表示是否有對內容上做出變更。您可以用任何合理的方式來行動,但不得以任何方式表明授權條款是對您許可或是由您所使用。
檔案歷史
點選日期/時間以檢視該時間的檔案版本。
| 日期/時間 | 縮圖 | 尺寸 | 使用者 | 備註 | |
|---|---|---|---|---|---|
| 目前 | 2009年5月18日 (一) 06:59 | | 3,006 × 2,827(588 KB) | Eubulides | {{Information |Description="Over age the graph architecture matures from a “local” organization to a “distributed” organization. In this figure we show the dynamic development and interaction of positive correlations between the two task control |
檔案用途
下列頁面有用到此檔案:
全域檔案使用狀況
以下其他 wiki 使用了這個檔案:
- en.wikipedia.org 的使用狀況
- he.wikipedia.org 的使用狀況
- it.wikipedia.org 的使用狀況
- pt.wikipedia.org 的使用狀況