File:Hill Curves for Increasing Hill Coefficients.jpg

預覽大小:800 × 496 像素。 其他解析度:320 × 198 像素 | 640 × 397 像素 | 824 × 511 像素。
原始檔案 (824 × 511 像素,檔案大小:57 KB,MIME 類型:image/jpeg)
摘要
| 描述 |
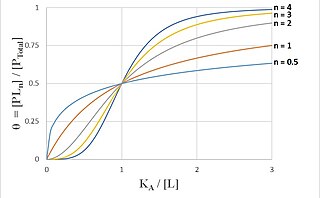
English: Biochemical showing the characteristically sigmoidal curves generated by using the Hill equation to model coperative binding in biochemistry. Each curve represents a different Hill coefficient: light blue corresponds to n=0.5, red to n=1, gray to n=2, yellow to n=3, and dark blue to n=4.
The vertical axis displays the Fraction (Theta) of occupied ligand-binding sites on a protein receptor, equal to ratio of the concentration of Ligand-bound Protein ([PLn_Total]) to the total concentration of Protein receptor ([P_Total]). The horizontal axis is the ratio of the ligand concentration producing half occupation (K_A) to the total Ligand concentration ([L]). |
| 日期 | |
| 來源 | 自己的作品 |
| 作者 | Abw20 |
授權條款
我,本作品的著作權持有者,決定用以下授權條款發佈本作品:
此檔案採用創用CC 姓名標示-相同方式分享 4.0 國際授權條款。
- 您可以自由:
- 分享 – 複製、發佈和傳播本作品
- 重新修改 – 創作演繹作品
- 惟需遵照下列條件:
- 姓名標示 – 您必須指名出正確的製作者,和提供授權條款的連結,以及表示是否有對內容上做出變更。您可以用任何合理的方式來行動,但不得以任何方式表明授權條款是對您許可或是由您所使用。
- 相同方式分享 – 如果您利用本素材進行再混合、轉換或創作,您必須基於如同原先的相同或兼容的條款,來分布您的貢獻成品。
檔案歷史
點選日期/時間以檢視該時間的檔案版本。
| 日期/時間 | 縮圖 | 尺寸 | 使用者 | 備註 | |
|---|---|---|---|---|---|
| 目前 | 2016年12月7日 (三) 03:16 | | 824 × 511(57 KB) | Abw20 | Fixed unnecessary white space. |
| 2016年12月7日 (三) 03:08 |  | 1,152 × 648(65 KB) | Abw20 | Made labels more readable. | |
| 2016年11月23日 (三) 17:28 |  | 760 × 513(55 KB) | Abw20 | User created page with UploadWizard |
檔案用途
下列頁面有用到此檔案:
全域檔案使用狀況
以下其他 wiki 使用了這個檔案:
- en.wikipedia.org 的使用狀況