File:Mpl example Helmoltz coils.svg

此 SVG 檔案的 PNG 預覽的大小:540 × 540 像素。 其他解析度:240 × 240 像素 | 480 × 480 像素 | 768 × 768 像素 | 1,024 × 1,024 像素 | 2,048 × 2,048 像素。
原始檔案 (SVG 檔案,表面大小:540 × 540 像素,檔案大小:63 KB)
摘要
| 描述 |
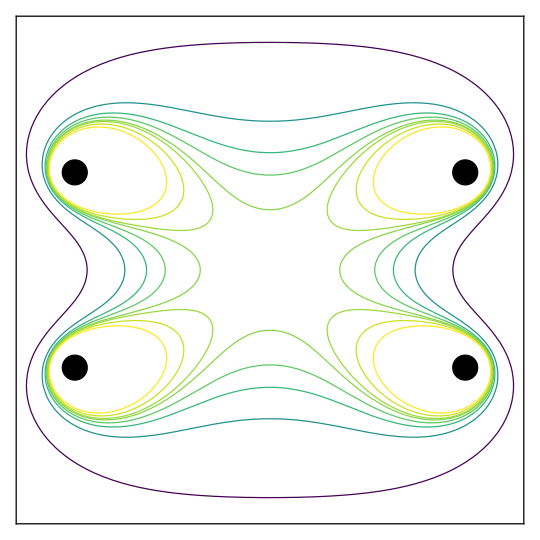
English: Cross section of B (magnetic field strength) magnitude in a Helmholtz coil (actually consisting of two coils: one at the top, one at the bottom in the plot). The eight contours are for field magnitudes of 0.5 {\displaystyle B_0}, 0.8 {\displaystyle B_0}, 0.9 {\displaystyle B_0}, 0.95 {\displaystyle B_0}, 0.99 {\displaystyle B_0}, 1.01 {\displaystyle B_0}, 1.05 {\displaystyle B_0}, and 1.1 {\displaystyle B_0}, where {\displaystyle B_0} is field strength at center. The large center area has almost uniform field strength. |
| 日期 | |
| 來源 | 自己的作品 |
| 作者 | Adrien F. Vincent |
| SVG開發 | 本向量圖形使用Matplotlib創作。 |
Rationale: this work aims at providing an up-to-date version of the similar work https://commons.wikimedia.org/wiki/File:Helmholtz_coil,_B_magnitude_cross_section.svg, done by Morn.
Source code has been modified into fully object-oriented matplotlib interface. It now uses the "viridis" colormap, instead of "jet" which produces perceptual glitches. Besides, some changes had to be done to work with versions of numpy more recent than the one originally used.
The matplotlib (mpl) version is 1.5.3, with Python 2.7 and numpy 1.10
##########
## Code for the figure
##########
# -*- coding: utf-8 -*-
from __future__ import division

import matplotlib.pyplot as plt
import numpy as np

from matplotlib.cm import viridis as colormap  # future default colormap

"""
Setup
"""
r = 1.0
res = 200  # grid resolution. 100 may be enough, resulting in smaller SVG file)

def dist3(a, b, c, d, e, f):
    """Compute the Euclidian distance from (d, e, f) to (a, b, c),
    raised to the 3rd power (and with lower boundary `r`).
    """
    return np.maximum(r, np.sqrt((a - d)**2 + (b - e)**2 + (c - f)**2))

x = np.linspace(-150, 150, res)
y = np.linspace(-150, 150, res)
X, Y = np.meshgrid(x, y)
F = np.zeros((res, res, 3))

"""
Computing part
"""
# Loop over two coils
for coils in [1.0, -1.0]:
    # Sum field contributions from coil in 10-degree steps
    for p in np.arange(0, 360, 10):
        xc = 100 * np.sin(np.pi * p / 180.0)
        yc = 50 * coils
        zc = 100 * np.cos(np.pi * p / 180.0)
        MAG = 1.0 / ((r + dist3(X, Y, 0.0, xc, yc, zc))**3)
        # (We leave out the necessary constants that would be required
        # to get proper units because only scaling behavior will be shown
        # in the plot. This is also why a sum instead of an integral
        # can be used.)
        #
        # Due to more stringent casting rules in recent Numpy (>=1.10),
        # one builds an explicit list of all the vectors (X - xc, Y - yc, -zc)
        # instead of relying on broadcasting. One then reshapes the array Z
        # (of the cross-product results) as previously expected.
        vectors = np.array([[xval - xc, yval - yc, -zc] for (xval, yval)
                            in zip(X.reshape(-1), Y.reshape(-1))])
        Z = np.cross(vectors, (-zc, 0.0, xc))
        Z = Z.reshape(res, res, 3)
        F += Z * MAG[:,:,np.newaxis]

# Compute the B-field
B = np.sqrt(F[..., 0]**2 + F[..., 1]**2 + F[..., 2]**2)
# Scale field strength by value at center
B = B / B[res // 2, res // 2]

"""
Plotting part
"""
fig_label = "helmoltz_coils"
plt.close(fig_label)
fig, ax = plt.subplots(figsize=(6, 6), num=fig_label, frameon=False)

levels = (0.5, 0.8, 0.9, 0.95, 0.99, 1.01, 1.05, 1.1)
cs = ax.contour(x, y, B, cmap=colormap, levels=levels)

# Add wire symbols
ax.scatter((100, 100, -100, -100), (50, -50, 50, -50), s=400, color="Black")

ax.axis((-130, 130, -130, 130))
ax.set_xticks([])
ax.set_yticks([])

plt.tight_layout()
plt.show()

fig.savefig("Helmholtz_coil,_B_magnitude_cross_section.svg")
##########
授權條款
我,本作品的著作權持有者,決定用以下授權條款發佈本作品:
此檔案採用共享創意 姓名標示-相同方式分享 4.0 國際授權條款。
- 您可以自由:
- 分享 – 複製、發佈和傳播本作品
- 重新修改 – 創作演繹作品
- 惟需遵照下列條件:
- 姓名標示 – 您必須指名出正確的製作者,和提供授權條款的連結,以及表示是否有對內容上做出變更。您可以用任何合理的方式來行動,但不得以任何方式表明授權條款是對您許可或是由您所使用。
- 相同方式分享 – 如果您利用本素材進行再混合、轉換或創作,您必須基於如同原先的相同或兼容的條款,來分布您的貢獻成品。
檔案歷史
點選日期/時間以檢視該時間的檔案版本。
| 日期/時間 | 縮圖 | 尺寸 | 用戶 | 備註 | |
|---|---|---|---|---|---|
| 目前 | 2016年9月27日 (二) 09:52 | | 540 × 540(63 KB) | Adrien F. Vincent | User created page with UploadWizard |
檔案用途
下列頁面有用到此檔案:
全域檔案使用狀況
以下其他 wiki 使用了這個檔案:
- bn.wikipedia.org 的使用狀況
- en.wikipedia.org 的使用狀況
- ko.wikipedia.org 的使用狀況
- pt.wikipedia.org 的使用狀況
- tr.wikipedia.org 的使用狀況