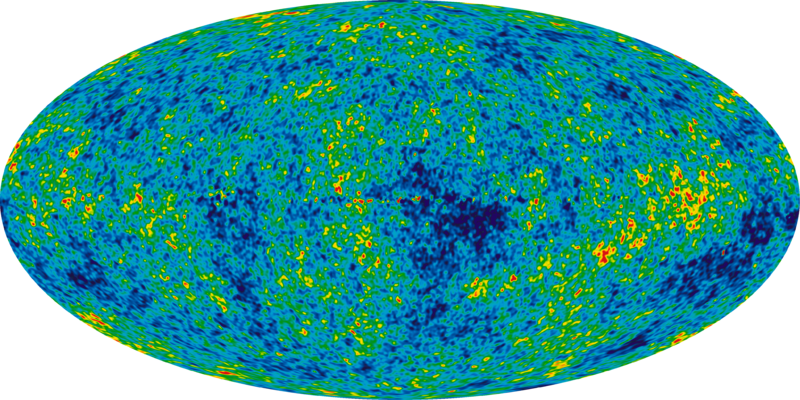
File:WMAP 2010.png

預覽大小:800 × 400 像素。 其他解析度:320 × 160 像素 | 640 × 320 像素 | 1,024 × 512 像素 | 1,280 × 640 像素 | 2,560 × 1,280 像素 | 4,096 × 2,048 像素。
原始檔案 (4,096 × 2,048 像素,檔案大小:2.86 MB,MIME 類型:image/png)
檔案歷史
點選日期/時間以檢視該時間的檔案版本。
| 日期/時間 | 縮圖 | 尺寸 | 用戶 | 備註 | |
|---|---|---|---|---|---|
| 目前 | 2010年7月14日 (三) 16:56 |  | 4,096 × 2,048(2.86 MB) | LobStoR | reduced palette from 32-bit RGB+alpha to 8-bit indexed -- with no loss of information |
| 2010年7月13日 (二) 17:03 |  | 4,096 × 2,048(5.83 MB) | LobStoR | optimized PNG using OptiPNG + AdvComp | |
| 2010年7月12日 (一) 19:21 |  | 4,096 × 2,048(8.76 MB) | Raeky | larger image from tiff with transparent bg | |
| 2010年3月2日 (二) 16:06 |  | 2,048 × 1,024(842 KB) | 0Zero0 | {{Information |Description={{en|1=The Cosmic Microwave Background temperature fluctuations from the 7-year Wilkinson Microwave Anisotropy Probe data seen over the full sky. T |
檔案用途
下列頁面有用到此檔案:
全域檔案使用狀況
以下其他 wiki 使用了這個檔案:
- af.wikipedia.org 的使用狀況
- ar.wikipedia.org 的使用狀況
- arz.wikipedia.org 的使用狀況
- br.wikipedia.org 的使用狀況
- ckb.wikipedia.org 的使用狀況
- cs.wikipedia.org 的使用狀況
- cy.wikipedia.org 的使用狀況
- de.wikipedia.org 的使用狀況
- el.wikipedia.org 的使用狀況
- en.wikipedia.org 的使用狀況
- Anisotropy
- Roger Penrose
- Wilkinson Microwave Anisotropy Probe
- User:Clementi
- User:WiccaIrish
- User:Nivenus
- User:Davidhill
- User:Mehranwahid
- Wikipedia:Featured pictures/Space/Understanding
- User:Zozoulia
- User:Pastel kitten
- User:Maurice Carbonaro/open source userboxes
- User:Vincenzo.romano
- User:Tcd88
- Wikipedia:Featured pictures thumbs/11
- User:Jacopo Werther
- User:SaturnCat
- Jürgen Ehlers
- User:Sarindam7
- Ehlers–Geren–Sachs theorem
- User talk:Iridia
- User:Apjohns54
- User:AxterJG
- Wikipedia:Picture of the day/Unused
- User:Alumnum
- User:Jlcoving
- User:RadicalOne/UBX Design
- User:RadicalOne/UBX Design/Cosmology
- User:Obankston
- User:Saukkomies/My userboxes
- Wikipedia:Featured picture candidates/delist/2010
- User:Jandris
- User talk:Magickair
- User:Letterman~enwiki
- User:Uploadvirus
檢視此檔案的更多全域使用狀況。


