File:Euclidean algorithm running time X Y.png
Euclidean_algorithm_running_time_X_Y.png (361 × 361 像素,檔案大小:22 KB,MIME 類型:image/png)
檔案歷史
點選日期/時間以檢視該時間的檔案版本。
| 日期/時間 | 縮圖 | 尺寸 | 用戶 | 備註 | |
|---|---|---|---|---|---|
| 目前 | 2012年11月15日 (四) 15:13 |  | 361 × 361(22 KB) | Hawky.diddiz | Optimized |
| 2008年2月24日 (日) 11:43 |  | 361 × 361(50 KB) | Rebroad | cropped image (as numbers were not visible in thumbnail images used in articles), | |
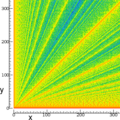
| 2006年3月18日 (六) 19:39 |  | 880 × 880(140 KB) | Maksim | La bildo estas kopiita de wikipedia:en. La originala priskribo estas: Plot of the number of iterations used by the Euclidean algorithm to compute gcd(x, y) for x and y from 0 to 800. (Red is 0, the following colors in the |
檔案用途
下列頁面有用到此檔案:
全域檔案使用狀況
以下其他 wiki 使用了這個檔案:
- ar.wikipedia.org 的使用狀況
- ast.wikipedia.org 的使用狀況
- ca.wikipedia.org 的使用狀況
- de.wikipedia.org 的使用狀況
- de.wikiversity.org 的使用狀況
- Kurs:Zahlentheorie (Osnabrück 2008)/Arbeitsblatt 3
- Euklidischer Algorithmus/Arbeitsblatt 1
- Euklidischer Algorithmus (Z)/Eigenschaften/Laufzeitbild/Aufgabe
- Kurs:Zahlentheorie (Osnabrück 2008)/Liegengelassene Aufgaben
- Kurs:Zahlentheorie (Osnabrück 2016-2017)/Arbeitsblatt 3
- Kurs:Zahlentheorie (Osnabrück 2016-2017)/Arbeitsblatt 3/kontrolle
- Kurs:Zahlentheorie (Osnabrück 2008)/Arbeitsblatt 3/kontrolle
- el.wikipedia.org 的使用狀況
- eo.wikipedia.org 的使用狀況
- es.wikipedia.org 的使用狀況
- eu.wikipedia.org 的使用狀況
- gl.wikipedia.org 的使用狀況
- pt.wikipedia.org 的使用狀況
- ro.wikipedia.org 的使用狀況
- sl.wikipedia.org 的使用狀況
- uk.wikipedia.org 的使用狀況

