File:Floor function.svg

此 SVG 檔案的 PNG 預覽的大小:600 × 600 像素。 其他解析度:240 × 240 像素 | 480 × 480 像素 | 768 × 768 像素 | 1,024 × 1,024 像素 | 2,048 × 2,048 像素 | 1,000 × 1,000 像素。
原始檔案 (SVG 檔案,表面大小:1,000 × 1,000 像素,檔案大小:16 KB)
摘要


授權條款
Created by User:Omegatron using gnuplot, possibly with post-processing in the GIMP (PNG) or Inkscape (SVG)
我,本作品的著作權持有者,決定用以下授權條款發佈本作品:

|
已授權您依據自由軟體基金會發行的無固定段落、封面文字和封底文字GNU自由文件授權條款1.2版或任意後續版本,對本檔進行複製、傳播和/或修改。該協議的副本列在GNU自由文件授權條款中。 |
您可以選擇您需要的授權條款。
(In short, this means that you can copy and modify the image freely as long as you provide attribution; preferably in the form of a link back to this page.)
Instructions
See Wikipedia graph-making tips.
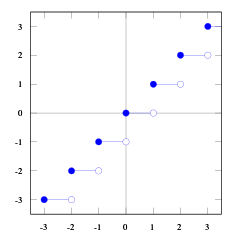
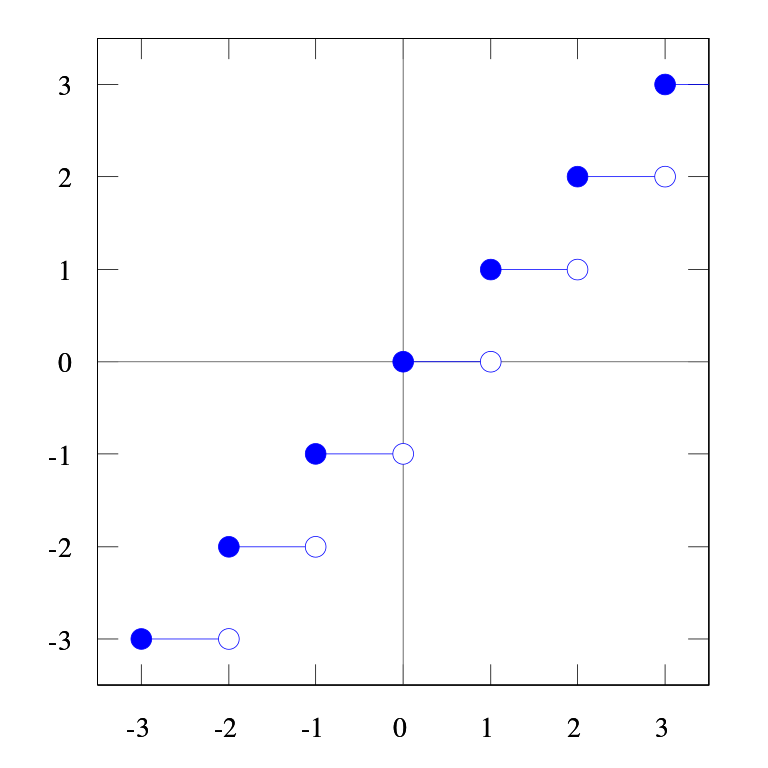
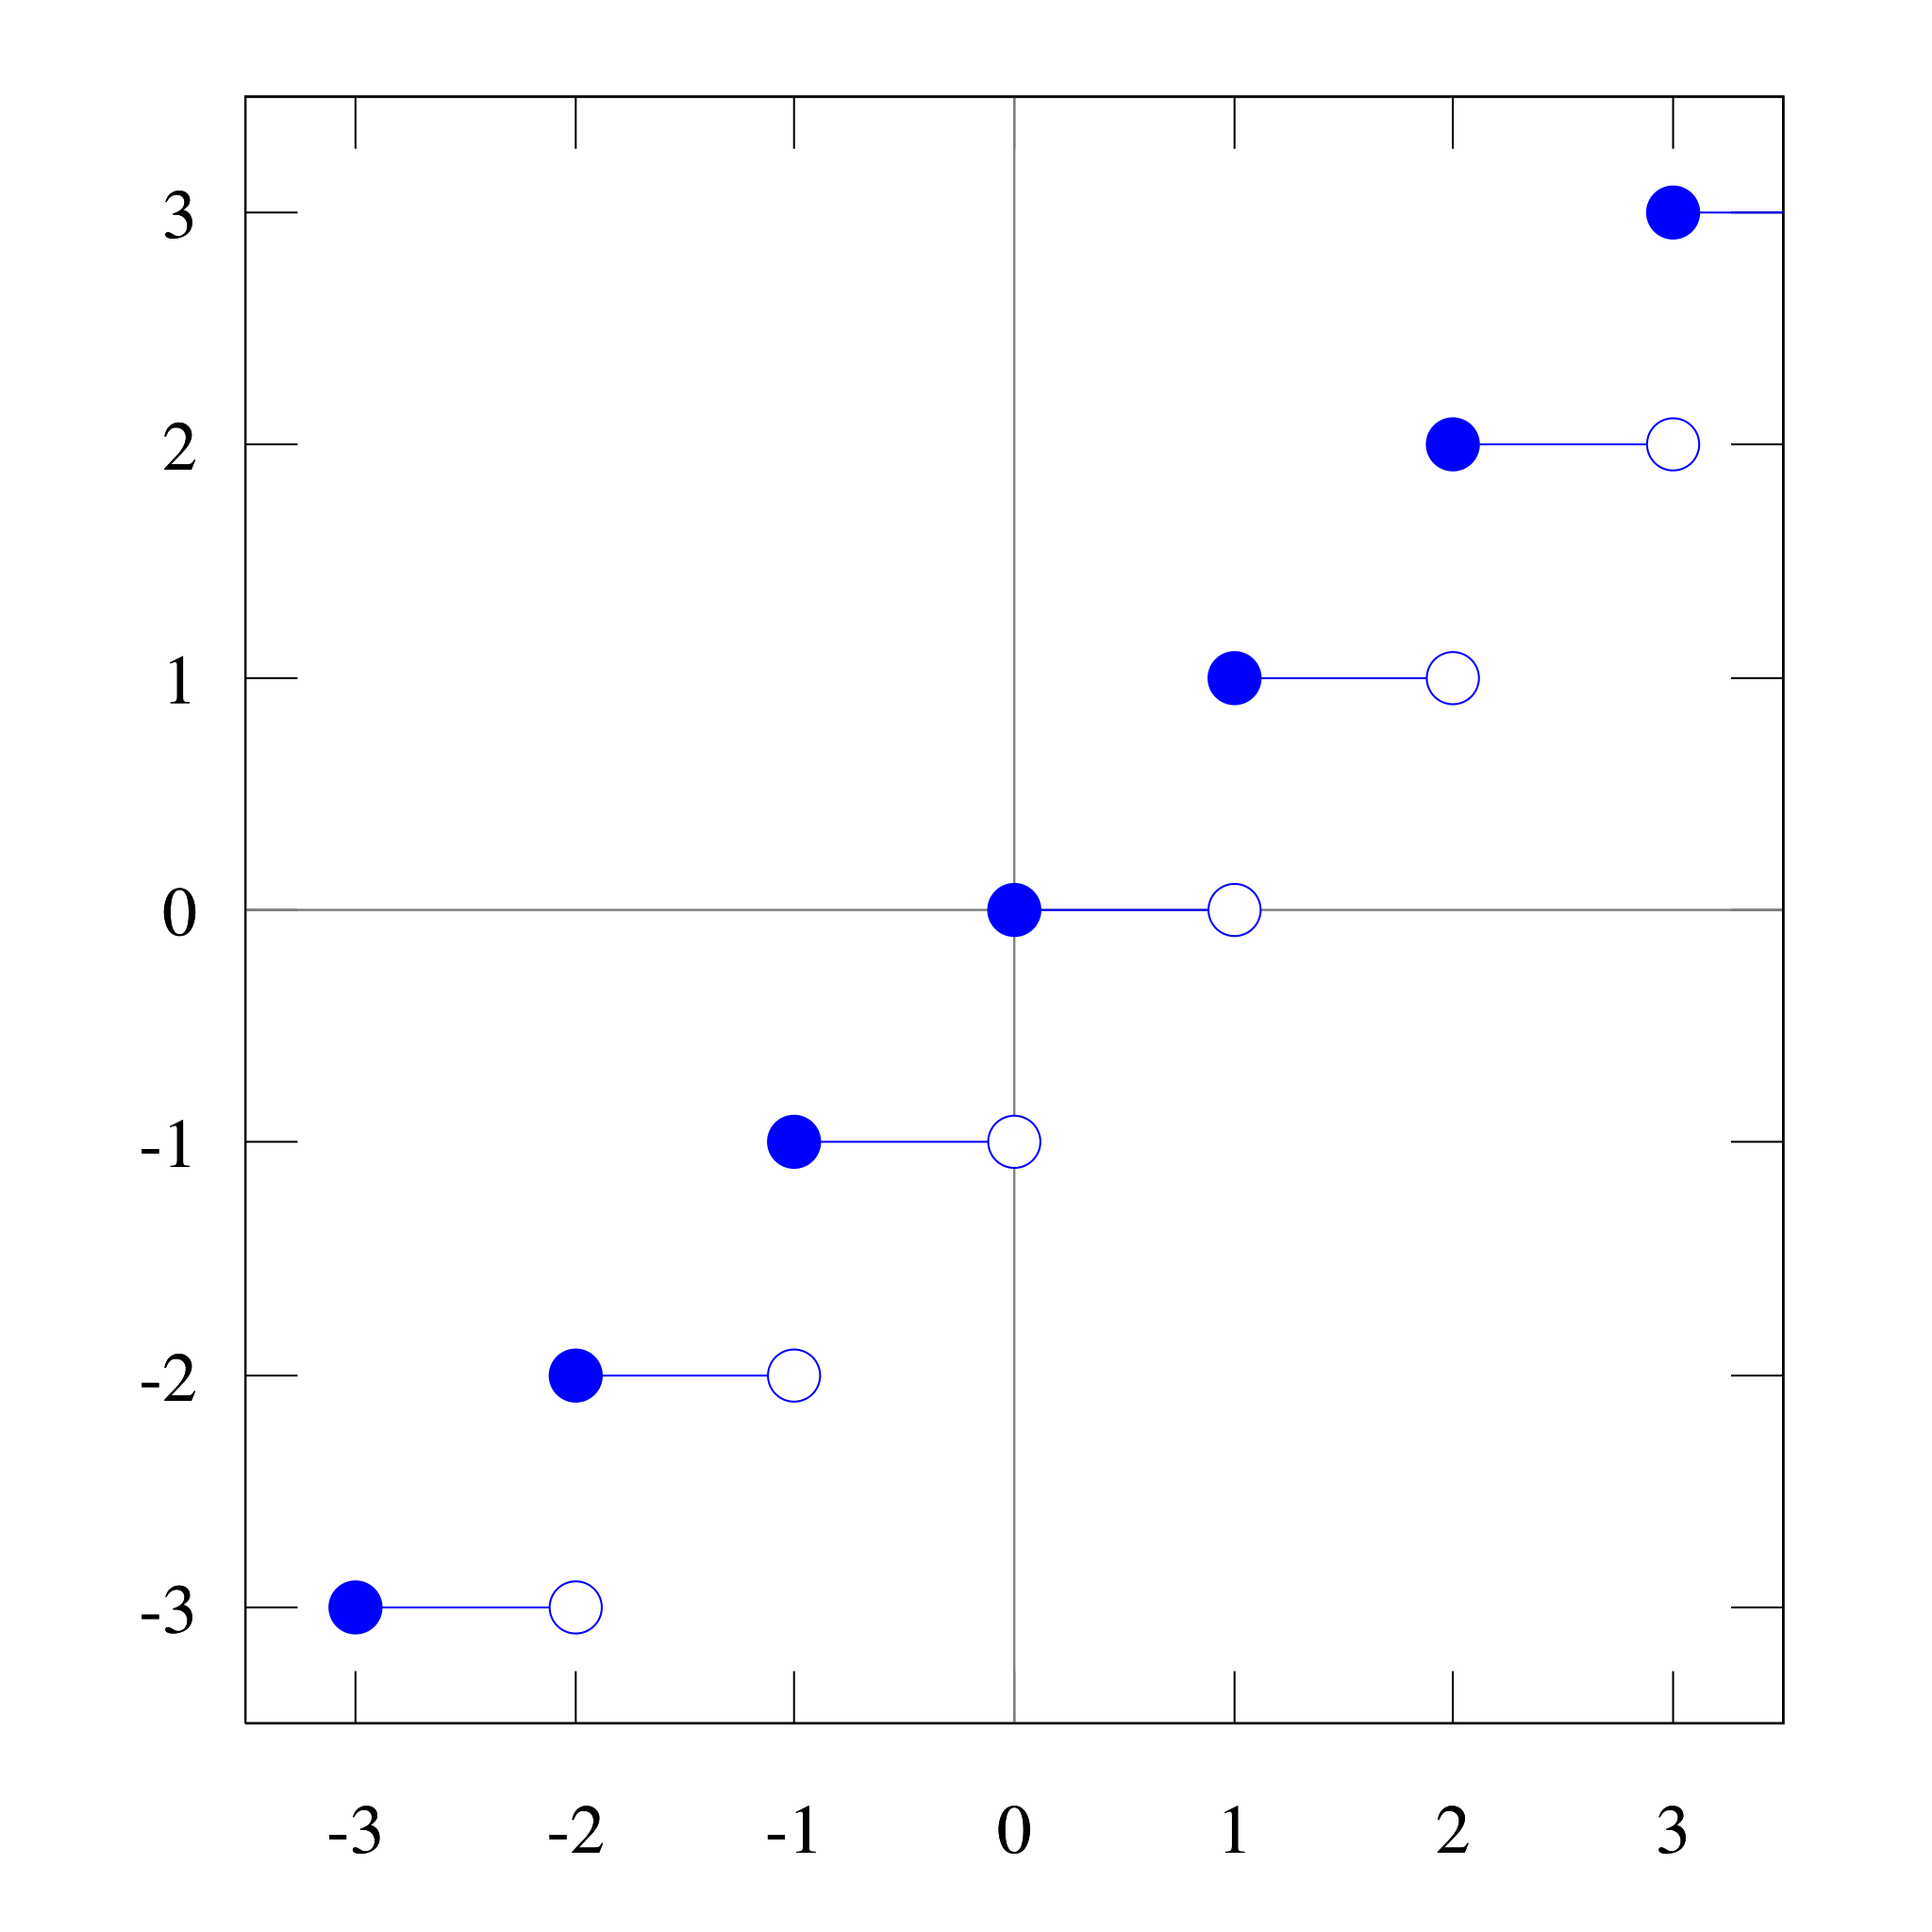
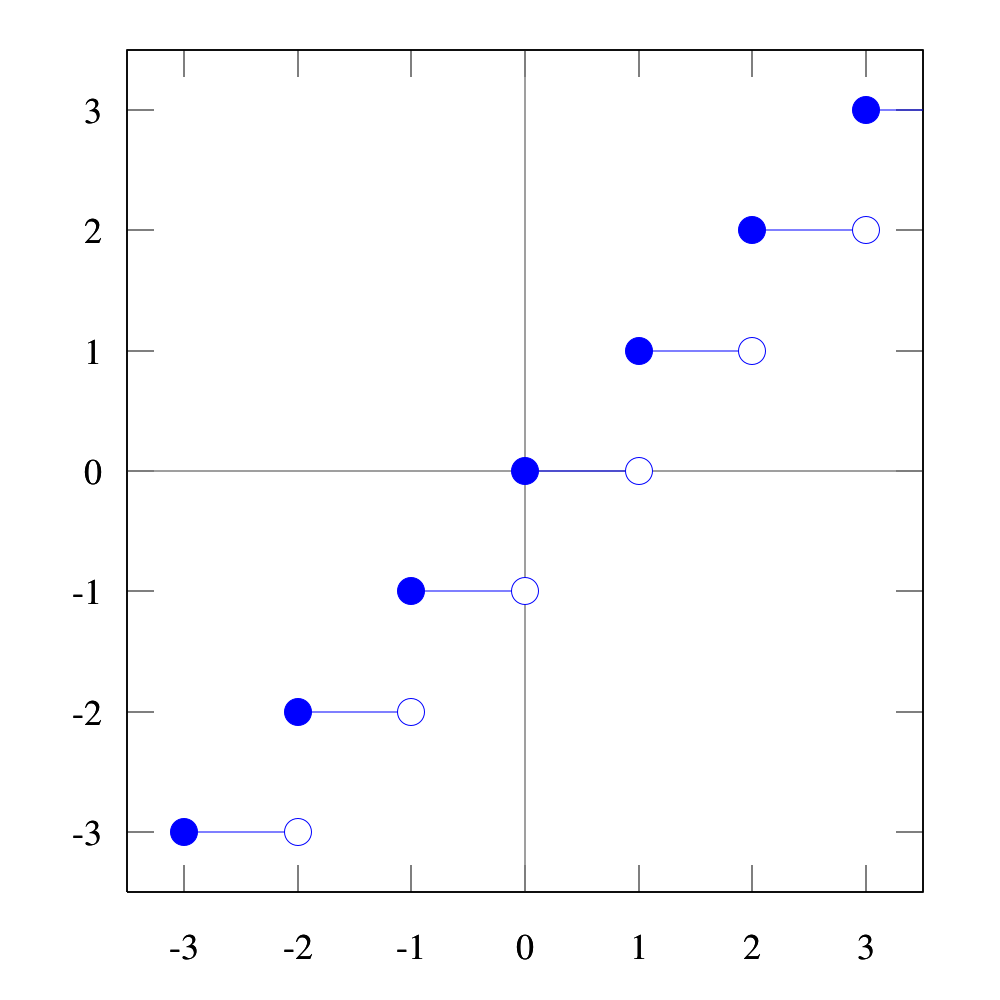
 # Set square 1000×1000 SVG output and filename
 # The font size (fsize) sets the size for the circles, too.
 set terminal svg enhanced size 1000 1000 fname "Times" fsize 36
 set output "floor.svg"

 # Set the text value for missing entries in the data file, so we can plot a [[w:discontinuous function|discontinuous function]]
 set datafile missing "Skip"

 # Set y axis limits so the plot doesn't go right to the edges of the graph
 set yrange [-3.5:3.5]
 # Set x axis limits so the first and last points are hidden
 set xrange [-3.5:3.5]

 # No legend needed
 set nokey

 # Add lightly-colored axis lines
 set yzeroaxis
 set xzeroaxis

 # Plot as lines and also points (circles)
 plot "floor.dat" with lines
 plot "floor.dat" with points 1 6

 # Close the file (so I don't have to close gnuplot to view it)
 set output
and data file:
floor.dat
#  X     Y1
   -3    -4
   Skip
   -3    -3
   -2    -3
   Skip
   -2    -2
   -1    -2
   Skip
   -1    -1
   0     -1
   Skip
   0     0
   1     0
   Skip
   1     1
   2     1
   Skip
   2     2
   3     2
   Skip
   3     3
   4     3
Then I opened the resulting SVG file in Inkscape, changed the fill style for the circles (either blue or white fill), brought the plot lines to the top, and then brought the circles to the top (over the lines).
External links
檔案歷史
點選日期/時間以檢視該時間的檔案版本。
| 日期/時間 | 縮圖 | 尺寸 | 用戶 | 備註 | |
|---|---|---|---|---|---|
| 目前 | 2006年5月22日 (一) 00:05 | | 1,000 × 1,000(16 KB) | Omegatron | i like blue better |
| 2006年4月11日 (二) 02:27 |  | 1,000 × 1,000(15 KB) | Omegatron | why is it a slightly different size from the others? | |
| 2006年4月8日 (六) 16:09 |  | 1,000 × 1,000(15 KB) | Omegatron | ||
| 2006年4月8日 (六) 16:00 |  | 1,000 × 1,000(15 KB) | Omegatron | ||
| 2006年4月8日 (六) 15:35 |  | 1,200 × 1,200(16 KB) | Omegatron | ideally the sizes could be set with relative units.... :-/ | |
| 2006年4月8日 (六) 15:31 |  | 1,600 × 1,600(16 KB) | Omegatron | ||
| 2006年3月30日 (四) 06:51 |  | 1,000 × 1,000(16 KB) | Omegatron |
檔案用途
下列頁面有用到此檔案:
全域檔案使用狀況
以下其他 wiki 使用了這個檔案:
- ar.wikipedia.org 的使用狀況
- cs.wikipedia.org 的使用狀況
- cv.wikipedia.org 的使用狀況
- da.wikipedia.org 的使用狀況
- de.wikipedia.org 的使用狀況
- de.wikiversity.org 的使用狀況
- Kurs:Vorkurs Mathematik (Osnabrück 2009)/Vorlesung 8
- Kurs:Mathematik (Osnabrück 2009-2011)/Teil I/Vorlesung 6
- Archimedisch angeordneter Körper/Einführung/Textabschnitt
- Kurs:Mathematik für Anwender (Osnabrück 2011-2012)/Teil I/Vorlesung 2
- Kurs:Analysis (Osnabrück 2013-2015)/Teil I/Vorlesung 4
- Kurs:Vorkurs Mathematik (Osnabrück 2013)/Vorlesung 3
- Kurs:Analysis (Osnabrück 2013-2015)/Teil I/Vorlesung 4/kontrolle
- Kurs:Vorkurs Mathematik (Osnabrück 2014)/Vorlesung 5
- Kurs:Analysis (Osnabrück 2014-2016)/Teil I/Vorlesung 4
- Kurs:Vorkurs Mathematik (Osnabrück 2014)/Vorlesung 5/kontrolle
- Kurs:Analysis (Osnabrück 2014-2016)/Teil I/Vorlesung 4/kontrolle
- Kurs:Grundkurs Mathematik (Osnabrück 2016-2017)/Teil I/Vorlesung 25
- Kurs:Grundkurs Mathematik (Osnabrück 2016-2017)/Teil I/Vorlesung 25/kontrolle
- Kurs:Grundkurs Mathematik (Osnabrück 2018-2019)/Teil I/Vorlesung 25
- Kurs:Grundkurs Mathematik (Osnabrück 2018-2019)/Teil I/Vorlesung 25/kontrolle
- Kurs:Mathematik für Anwender (Osnabrück 2019-2020)/Teil I/Vorlesung 5
- Kurs:Mathematik für Anwender (Osnabrück 2019-2020)/Teil I/Vorlesung 5/kontrolle
- Kurs:Mathematik für Anwender (Osnabrück 2019-2020)/Teil I/Repetitorium/Vorlesung 5
- Kurs:Mathematik für Anwender (Osnabrück 2020-2021)/Teil I/Vorlesung 5
- Kurs:Mathematik für Anwender (Osnabrück 2020-2021)/Teil I/Vorlesung 5/kontrolle
- Kurs:Analysis (Osnabrück 2021-2023)/Teil I/Vorlesung 4
- Kurs:Vorkurs Mathematik (Osnabrück 2021)/Vorlesung 5
- Kurs:Vorkurs Mathematik (Osnabrück 2021)/Vorlesung 5/kontrolle
- Zifferndarstellung/Konvergenz/Cauchy-Folge/Rekursion/Periodizität/Textabschnitt
- Kurs:Analysis (Osnabrück 2021-2023)/Teil I/Vorlesung 4/kontrolle
- Archimedisch angeordneter Körper/Sand/Einführung/Textabschnitt
- Kurs:Grundkurs Mathematik (Osnabrück 2022-2023)/Teil I/Vorlesung 25
- Kurs:Grundkurs Mathematik (Osnabrück 2022-2023)/Teil I/Vorlesung 25/kontrolle
- Kurs:Vorkurs Mathematik (Osnabrück 2009)/Vorlesung 8/kontrolle
- Kurs:Vorkurs Mathematik (Osnabrück 2013)/Vorlesung 3/kontrolle
- Kurs:Mathematik für Anwender (Osnabrück 2011-2012)/Teil I/Vorlesung 2/kontrolle
- Kurs:Mathematik für Anwender (Osnabrück 2023-2024)/Teil I/Vorlesung 5
- Kurs:Mathematik für Anwender (Osnabrück 2023-2024)/Teil I/Vorlesung 5/kontrolle
- Distanzdiskrete Vektorräume
- de.wiktionary.org 的使用狀況
- el.wikipedia.org 的使用狀況
- en.wikipedia.org 的使用狀況
檢視此檔案的更多全域使用狀況。