File:Major cities threatened by sea level rise.png
原始檔案 (1,425 × 625 像素,檔案大小:29 KB,MIME 類型:image/png)
摘要
| 描述 |
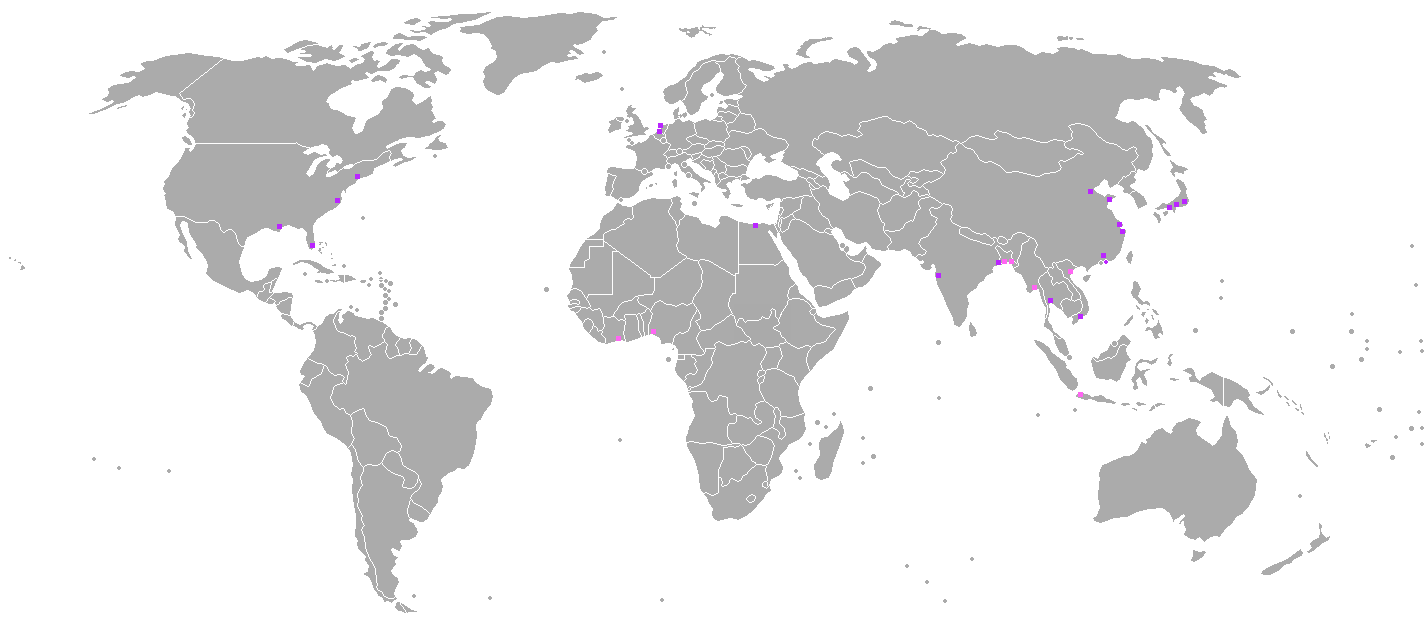
English: Map showing the major cities (in terms of assets and population) that are under threat by the rising sea level. The cities indicated are under threat of even a small sea level rise (of 1.6 foot/49 cm) compared to the level in 2010). Even moderate projections indicate that such a rise will have occured by 2060[1][2]
The map was based on data of a 2007 OECD report[3][4] The report also stated that the total value of the assets exposed in 2005 across all cities is about US$3,000 billion. The top 20 cities in the world in terms of assets exposed to coastal flooding was marked in purple; additional cities that are in the top 20 in terms of population exposed to coastal flooding were marked in pink (there are only 27 cities on the whole map since these cities that have the largest amount of assets exposed to it also have the most people exposed to it). The list of the top 20 cities exposed to coastal flooding is:
The list of 7 additional cities that are in the top 20 most-populous cities exposed to coastal flooding is:
|
| 日期 | |
| 來源 | 自己的作品 |
| 作者 | Genetics4good |
授權條款
- 您可以自由:
- 分享 – 複製、發佈和傳播本作品
- 重新修改 – 創作演繹作品
- 惟需遵照下列條件:
- 姓名標示 – 您必須指名出正確的製作者,和提供授權條款的連結,以及表示是否有對內容上做出變更。您可以用任何合理的方式來行動,但不得以任何方式表明授權條款是對您許可或是由您所使用。
- 相同方式分享 – 如果您利用本素材進行再混合、轉換或創作,您必須基於如同原先的相同或兼容的條款,來分布您的貢獻成品。
- ↑ File:Projections of global mean sea level rise by Parris et al. (2012).png
- ↑ Sea level rise chart
- ↑ 2007 OECD report
- ↑ OECD report, shortened version
.png)
檔案歷史
點選日期/時間以檢視該時間的檔案版本。
| 日期/時間 | 縮圖 | 尺寸 | 用戶 | 備註 | |
|---|---|---|---|---|---|
| 目前 | 2016年1月10日 (日) 23:31 | | 1,425 × 625(29 KB) | Magog the Ogre | Reverted to version as of 12:52, 2 November 2013 (UTC) |
| 2013年11月2日 (六) 12:52 |  | 1,425 × 625(29 KB) | Genetics4good | User created page with UploadWizard |
檔案用途
下列頁面有用到此檔案:
全域檔案使用狀況
以下其他 wiki 使用了這個檔案:
- en.wikipedia.org 的使用狀況
- en.wikiquote.org 的使用狀況
- es.wikipedia.org 的使用狀況
- ig.wikipedia.org 的使用狀況
- mk.wikipedia.org 的使用狀況