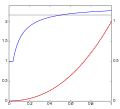
File:SRGB gamma.svg

此 SVG 檔案的 PNG 預覽的大小:512 × 464 像素。 其他解析度:265 × 240 像素 | 530 × 480 像素 | 847 × 768 像素 | 1,130 × 1,024 像素 | 2,260 × 2,048 像素。
原始檔案 (SVG 檔案,表面大小:512 × 464 像素,檔案大小:1 KB)
檔案歷史
點選日期/時間以檢視該時間的檔案版本。
| 日期/時間 | 縮圖 | 尺寸 | 用戶 | 備註 | |
|---|---|---|---|---|---|
| 目前 | 2020年6月2日 (二) 16:05 |  | 512 × 464(1 KB) | Jarvisa | Simplified SVG source |
| 2008年4月23日 (三) 21:40 |  | 512 × 463(62 KB) | Morningfrost | {{Information |Description=I made this in matlab to show the sRGB gamma expansion curve (red), the gamma 2.2 power law (black, behind the red mostly), and the local gamma of the sRGB curve (blue). |Source=English Wikipedia |Date= |Author=user Dicklyon, en |
檔案用途
下列頁面有用到此檔案:
全域檔案使用狀況
以下其他 wiki 使用了這個檔案:
- en.wikipedia.org 的使用狀況
- fr.wikibooks.org 的使用狀況
- it.wikipedia.org 的使用狀況
- ja.wikipedia.org 的使用狀況
- pl.wikipedia.org 的使用狀況
