中华人民共和国可再生能源
中华人民共和国是世界领先的可再生能源发电国家,发电量是排名第二的美国的三倍多。中国可再生能源领域的增长速度超过其化石燃料和核电能力,贡献了全球可再生能源产能增长的43%。[1]2015年中国成为世界上最大的光伏发电生产国,装机容量为43GW[2]。中国还领导世界生产和使用风能和智能电网技术,生产的水电,风能和太阳能几乎等于法国的和德国的发电厂发电的总和。[3]2021年中国可再生能源总装机容量超过1000GW,占全国总发电容量的43.5%,比2015年提高10.2个百分点。中国的目标是到2060年实现80%的能源结构来自非化石能源,以及到2030年在太阳能和风能总装机容量上达到1200GW。[1]


虽然中国拥有世界上最大的太阳能和风力发电装置,但因能源需求极大及持续增长,以至在2019年中国的可再生能源只提供了所需的26%发电量,对比下美国为17%[4]。虽然比起2013年的20%已有明显的进步,但目前为止大部分能源供应都仍然是由传统煤电设施提供。[5]尽管如此,近年来可再生能源在能源结构中的比重明显快速上升。2020年,可再生能源约占中国电力新总装机容量的40%,占总发电量已达26%。到2025年可再生能源在总发电量中的份额预计将增加至33-36%。另外中国已承诺在2060年前实现碳中和,并在2030年前达到排放峰值[6][7]。
另外,中国也将可再生能源的发展视为自身能源安全的重要战略目标,而不仅仅是为了减少碳排放。[8]中国国务院于2013年9月发布了《中国大气污染防治行动计划》,表明希望增加可再生能源在中国能源结构中的份额。[9]这是因为与容易受到地缘政治紧张局势影响而且供应有限的石油、煤炭和天然气不同,可再生能源系统可以在有足够水、风和阳光的地方建造和使用,确保能源在最大范围内实现自给自足。[10]
随着中国可再生能源制造业的快速发展,全球可再生能源技术的成本已大幅下降。虽然创新有所帮助,但降低成本的主要驱动因素是市场扩张。[11]2015年,中国成为全球最大的光伏发电生产国,总装机容量为43GW。[12][13]从2005年到2014年,中国太阳能电池的产量增长了100倍,同时带动了全世界范围内太阳能板的价格大幅回落。[14]预计到2022年实现可再生能源比化石燃料更便宜。[15]
中国同时也是全球最大的可再生能源投资国、生产国和消费国,同时也是制造最先进的太阳能电池板、风力涡轮机和水力发电设施的国家,并成为世界上最大的电动汽车和电动公共汽车的生产国。[16]。2016年全球五大可再生能源交易中,中国企业占四笔。2017年全球可再生能源投资2798亿美元,其中中国占了全球投资的45%。[17]
中国可再生能源发电总览
编辑由于已知的技术原因,图表暂时不可用。带来不便,我们深表歉意。 |
| 年份 | 总发电量 | 化石 | 核能 | 可再生 | 可再生的总发电量 (包括废物,基于表格数据) | 可再生的估计的发电量% (基于表格数据) | |||||||||
|---|---|---|---|---|---|---|---|---|---|---|---|---|---|---|---|
| 煤炭 | 石油 | 天然气 | 废物 | 水力 | 风力 | 生物燃料 | 太阳能光伏 | 太阳能聚热 | 地热 | 潮汐 | |||||
| 2008 | 3,481,985 | 2,743,767 | 23,791 | 31,028 | 68,394 | 0 | 585,187 | 14,800 | 14,715 | 152 | 0 | 144 | 7 | 615,005 | 17.66% |
| 2009 | 3,741,961 | 2,940,751 | 16,612 | 50,813 | 70,134 | 0 | 615,640 | 26,900 | 20,700 | 279 | 0 | 125 | 7 | 663,651 | 17.74% |
| 2010 | 4,207,993 | 3,250,409 | 13,236 | 69,027 | 73,880 | 9,064 | 722,172 | 44,622 | 24,750 | 699 | 2 | 125 | 7 | 801,441 | 19.05% |
| 2011 | 4,715,761 | 3,723,315 | 7,786 | 84,022 | 86,350 | 10,770 | 698,945 | 70,331 | 31,500 | 2,604 | 6 | 125 | 7 | 814,288 | 17.27% |
| 2012 | 4,994,038 | 3,785,022 | 6,698 | 85,686 | 97,394 | 10,968 | 872,107 | 95,978 | 33,700 | 6,344 | 9 | 125 | 7 | 1,019,238 | 20.41% |
| 2013 | 5,447,231 | 4,110,826 | 6,504 | 90,602 | 111,613 | 12,304 | 920,291 | 141,197 | 38,300 | 15,451 | 26 | 109 | 8 | 1,127,686 | 20.70% |
| 2014 | 5,678,945 | 4,115,215 | 9,517 | 114,505 | 132,538 | 12,956 | 1,064,337 | 156,078 | 44,437 | 29,195 | 34 | 125 | 8 | 1,307,170 | 23.02% |
| 2015 | 5,859,958 | 4,108,994 | 9,679 | 145,346 | 170,789 | 11,029 | 1,130,270 | 185,766 | 52,700 | 45,225 | 27 | 125 | 8 | 1,425,150 | 24.32% |
| 2016 | 6,217,907 | 4,241,786 | 10,367 | 170,488 | 213,287 | 11,413 | 1,193,374 | 237,071 | 64,700 | 75,256 | 29 | 125 | 11 | 1,581,979 | 25.44% |
| 2017 | 6,452,900 | 248,100 | 1,194,700 | 304,600 | 117,800 | 1,700,000 | 26.34% | ||||||||
| 2018 | 6,994,700 | 4,482,900 | 1,500 | 215,500 | 295,000 | 1,232,100 | 365,800 | 93,600 | 176,900 | 1,868,400 | 26.71% | ||||
| 2019 | 7,326,900 | 4,553,800 | 1,300 | 232,500 | 348,700 | 1,302,100 | 405,300 | 112,600 | 224,000 | 2,044,000 | 27.76% | ||||
| 2020 | 7,623,600 | 5,174,300[21] | 366,200 | 1,355,200 | 466,500 | 261,100 | 2,082,800[22] | 27.32% | |||||||
| 2021 | 8,376,800 | 5,646,300 | 407,500 | 1,340,100 | 655,600 | 327,000 | 2,322,700 | 27.73% | |||||||
| 年份 | 总发电量 | 化石 | 核能 | 可再生 | 可再生的总发电量 (包括废物,基于表格数据) | 可再生的估计的发电量% (基于表格数据) | ||||||
|---|---|---|---|---|---|---|---|---|---|---|---|---|
| 煤炭 | 石油 | 天然气 | 水力 | 风力 | 太阳能光伏 | 废物、生物质、余温等 | 其他 | |||||
| 2008 | 3,451,013 | 2,802,997 | 69,219 | 565,548 | 13,079 | 169 | 578,796 | 16.77% | ||||
| 2009 | 3,681,186 | 2,872,918 | 17,114 | 56,685 | 70,050 | 571,682 | 27,615 | 65,121 | 664,418 | 18.05% | ||
| 2010 | 4,227,771 | 3,260,018 | 16,226 | 77,910 | 74,742 | 686,736 | 49,400 | 121 | 61,844 | 143 | 798,245 | 18.88% |
| 2011 | 4,730,582 | 3,706,679 | 5,900 | 109,110 | 87,201 | 668,112 | 74,055 | 679 | 78,713 | 145 | 821,704 | 17.37% |
| 2012 | 4,986,526 | 3,713,064 | 5,538 | 110,252 | 98,318 | 855,552 | 103,050 | 3,595 | 96,680 | 478 | 1,059,354 | 21.24% |
| 2013 | 5,372,057 | 3,980,520 | 5,211 | 116,388 | 111,501 | 892,070 | 138,264 | 8,374 | 119,451 | 278 | 1,158,437 | 21.56% |
| 2014 | 5,680,084 | 4,026,589 | 4,424 | 133,283 | 133,218 | 1,060,089 | 159,763 | 23,512 | 138,671 | 535 | 1,382,570 | 24.34% |
| 2015 | 5,739,950 | 3,897,746 | 4,155 | 166,907 | 171,378 | 1,112,694 | 185,591 | 39,481 | 161,850 | 148 | 1,499,764 | 26.13% |
| 2016 | 6,022,845 | 3,945,678 | 2,782 | 188,280 | 213,178 | 1,174,837 | 240,860 | 66,528 | 190,577 | 124 | 1,672,926 | 27.78% |
| 2017 | 6,417,109 | 4,149,763 | 2,723 | 202,760 | 248,125 | 1,193,062 | 303,420 | 116,618 | 200,514 | 125 | 1,813,738 | 28.26% |
| 2018 | 6,994,700 | 4,482,900 | 1,500 | 215.500 | 295,000 | 1,232,100 | 365,800 | 176,900 | 225,000 | 100 | 1,999,900 | 28.59% |
| 2019 | 7,325,300 | 348,700 | 1,301,900 | 405,700 | 223,800 | 29.41% | ||||||
截至2019年底,该国可再生能源总装机容量为790GW,主要来自水电、太阳能和风能,[24]水电装机容量达到356GW。[25]
截至2020年,中国太阳能装机容量达到252吉瓦,风电装机容量为282吉瓦。[26][27]水电、风电、太阳能和生物质能的装机容量分别增加到385GW、299GW、282GW和35.34GW。[1]
截至2021年底,水力发电仍然是中国可再生电力生产中的最大组成部分,达到1,340百万兆瓦。风能以655百万兆瓦位居第二,然后是生物燃料,为44百万兆瓦。太阳能光伏发电从2008年起迅速增长,从仅为152吉瓦的低基数开始,增长到2021年的327百万兆瓦,并且预计太阳能和风能会继续快速增长。可再生能源发电的总体份额从2008年的17%,增到到2021年的略高于27.7%。
风力发电
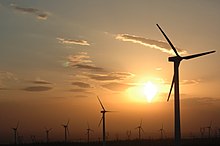
编辑中国的风力发电技术及产能都处于世界领先地位,自2010年以来中国就成为世界上最大的风电装机容量市场[28],拥有世界上最大的装机容量,并且持续地保持快速增长[29][30]。中国广阔的领土及漫长的海岸线使到发展风能资源较为容易,据估计,在中国陆地上可开发的风电约为 2,380 GW,海上可开发容量约为 200GW[31][32]。位于甘肃酒泉市外的风电场是现时世界上最大的风电场,达到7,965 MV的发电量。截止2021年底,风电是中国第三大电力来源,占总发电量的 7.5%,达328 吉瓦 (GW),是2020年底欧盟的1.4倍,美国的2.6倍,已连续12年居世界第一[33]。而根据全球风能理事会《2022年全球风能报告》的统计,2021年中国陆上风电新增装机容量30.7 GW,占全球42.34%,海上风电新增装机容量占全球80.02%,离岸风力发电量方面超过了英国和德国,成为全球最大的离岸风力发电市场,占全球总装机容量的40%。
中国在风电研究上也领先世界,根据Reddie & Grose 的研究显示,在2010年至2020年间中国的风能专利申请量排名第一。 在同一时间段内,欧洲产生了 16,396 件专利申请,美国产生了 16,074 件专利申请。 韩国和日本分别以 6,611 件和 3,809 件紧随其后。中国同时也是全球最大的风电设备制造基地,而金风科技是中国最大的国产风机制造商[34]。
自2020年以来,中国的风力发电容量的增长速度超过了太阳能发电容量。在2020至2022年间,中国风电装机年均增长178.6太瓦时(TWh),比2015-2020年年均增长350%。相比之下,中国的太阳能装机容量在 2021-22 年平均增长了 78.3 TWh,大约是 2015 年至 2020 年 39.6 TWh 年增长率的两倍。这是因为对于像中国这样的工业国,风力发电通常优于太阳能因为风力涡轮机能够全天候发电,而太阳能发电量随着太阳落山而下降[35]。
太阳能发电
编辑能源生产和消费
编辑截至2020年,中国84.33%的能源消费依赖化石燃料,其中56.56%依赖煤炭,对比起2011年的70%已有明显的降幅,不过这些化石燃料产生了约99亿吨二氧化碳,占了全球排放量的30.9%[36][37]。截至2021年,中国水电占7.727%,核能占2.32%,其他可再生能源占7.141%[38]。能源专家估计,到2050年中国煤炭发电的份额将下降到30%–50%,其余50%–70%将来自石油、天然气、和各种可再生能源。[38]
另外,中国寻求外国能源来源多样化,增强了能源安全,使中国不易受到供应中断的影响。除了大力发展可再生能源外,中国和俄国开始进行电网互联,俄罗斯向中国提供天然气,从而节约国内资源,降低能源消耗,减少中国对进口石油的依赖。2022年12月21日,中俄东线天然气管道实现全线贯通,预计到2023年管线输送的天然气将增加到380亿立方米,以供应中国东北地区的能源需求[39][40]。中国也打算建设多条长距离高压大容量国际输电线路,连接到蒙古和几个与中国接壤的前苏联国家。截至2020年,俄罗斯累计向中国出口电力30.42太瓦时,减少中国煤炭消费1017万吨[41]。
2021年中国总发电量为8571.4太瓦时,高于2020年的7814.3太瓦时,装机容量为2380吉瓦,其中风力发电占12.6%,太阳能发电占12.2%。[42][43]
电力输送的挑战
编辑中国的可再生能源面临的主要挑战是输送电力的问题,由于中国国土面积巨大,人口分布及可再生能源分布并不平均,大多数人口聚集在东部及南部的沿海地区,但多数太阳能及风力资源却在相对地广人稀的西部地区,这导致可再生能源发发出来后,却无法有效地把电力输送到真正对能源有巨大需要的沿海城市[44]。比如2014年时中国西部的甘肃省全年用电量为1095亿千瓦时,相当于12.5 GW的平均负载容量,然而当地的可再生能源装机容量却已达到17吉瓦,当时也并没有有效方式把多余的电力输送给其他电力紧张的城市,最终造成能源上的严重浪费[45]。这问题的解决方法就是在全国范围内建设一个巨型的特高压输电网络,实现长途高效输电[46]。中国目前已有并且领导相关技术,电网建设也已经快速进行,但由于建设的时间及连接电网需时通常是建造再生能源发电厂所需时间的两倍多,因此造成明显的时间滞后,令到每年依旧有大量电力被浪费[45]。中国政府目前正展开广泛的基础设施计划,确保可再生能源并输电网络保持平衡[47]。
另一个解决方式则是在不同省份发展合适的再生能源。根据全球能源监测 (GEM) 的数据显示,中国近年大力发展的风力发电已使到几个主要省份的能源结构大幅改善。南方的广东、东部沿海的福建、北方的山西和河北等中国主要工业制造业中心需要的电力巨大,原本是严重依赖化石燃料或西部地区的输电,但得益于技术的改善及进步,这些省份也开始大力发展再生能源,主要是风电。这是因为风电能够全天候发电,而太阳能发电量随着太阳落山而下降,对工业大省来说持续不停的供电是最重要的。另外中国海上风电的技术近年得到突破,而这些省份大多都是沿海的,因此海上风电装机量明显增加。这种能源结构改变有助于当地电力生产商减少对高排放化石燃料的依赖,同时减少长距离输电的需求,减轻电网的压力[48]。
参见
编辑参考资料
编辑- ^ 1.0 1.1 1.2 存档副本. [2022-04-10]. (原始内容存档于2022-05-20).
- ^ Reuters Editorial. China's solar capacity overtakes Germany in 2015, industry data show. Reuters. 21 January 2016 [2016-11-08]. (原始内容存档于2018-01-29).
- ^ Chinese solar capacity outshone Germany's in 2015. http://www.businessgreen.com. [2016-11-08]. (原始内容存档于2018-11-09). 外部链接存在于
|work=(帮助) - ^ 2019 electricity & other energy statistics (preliminary). China Energy Portal | 中国能源门户. 2020-01-21 [2021-01-06]. (原始内容存档于2021-11-22) (英语).
- ^ IEA - Report. www.iea.org. [2017-11-12]. (原始内容存档于2017-10-15).
- ^ China could exceed renewables generation target of 33% by 2025. 23 September 2022 [2023-01-24]. (原始内容存档于2023-01-28).
- ^ Reuters. China says a third of electricity will come from renewables by 2025. Reuters. 2022-06-01 [2023-01-24]. (原始内容存档于2023-01-31) (英语).
- ^ Deng, Haifeng and Farah, Paolo Davide and Wang, Anna, China's Role and Contribution in the Global Governance of Climate Change: Institutional Adjustments for Carbon Tax Introduction, Collection and Management in China (24 November 2015). Journal of World Energy Law and Business, Oxford University Press, Volume 8, Issue 6, December 2015. Available at SSRN: http://ssrn.com/abstract=2695612 (页面存档备份,存于互联网档案馆)
- ^ Andrews-Speed, Philip. China's Energy Policymaking Processes and Their Consequences. The National Bureau of Asian Research Energy Security Report. November 2014 [5 December 2014]. (原始内容存档于2018-08-06).
- ^ John A. Mathews & Hao Tan. Economics: Manufacture renewables to build energy security. Nature. 10 September 2014, 513 (7517): 166–168 [2016-11-14]. Bibcode:2014Natur.513..166M. PMID 25209783. S2CID 4459313. doi:10.1038/513166a. (原始内容存档于2019-11-12).
- ^ John A. Mathews & Hao Tan. Economics: Manufacture renewables to build energy security. Nature. 10 September 2014, 513 (7517): 166–168 [2016-11-14]. Bibcode:2014Natur.513..166M. PMID 25209783. S2CID 4459313. doi:10.1038/513166a. (原始内容存档于2019-11-12).
- ^ Reuters Editorial. China's solar capacity overtakes Germany in 2015, industry data show. Reuters. 21 January 2016 [2020-12-12]. (原始内容存档于2019-07-08).
- ^ Chinese solar capacity outshone Germany's in 2015. businessgreen.com. 21 January 2016 [2016-11-08]. (原始内容存档于2018-11-09).
- ^ John A. Mathews & Hao Tan. Economics: Manufacture renewables to build energy security. Nature. 10 September 2014, 513 (7517): 166–168 [2016-11-14]. Bibcode:2014Natur.513..166M. PMID 25209783. S2CID 4459313. doi:10.1038/513166a. (原始内容存档于2019-11-12).
- ^ N, Sushma U. India is beating China in the race to build massive solar power projects. Quartz. [22 May 2018]. (原始内容存档于2018-07-26) (美国英语).
- ^ Commentary: China will bet big on clean energy to achieve carbon neutrality. [2022-04-10]. (原始内容存档于2021-07-11).
- ^ Frankfurt School – UNEP Collaborating Centre for Climate & Sustainable Energy Finance (2018). Global Trends in Renewable Energy Investment 2018. Available online at: https://europa.eu/capacity4dev/unep/documents/global-trends-renewable-energy-investment-2018 (页面存档备份,存于互联网档案馆)
- ^ IEA - Report. www.iea.org. [23 September 2017]. (原始内容存档于2018-07-03).
- ^ 2020 electricity & other energy statistics (preliminary). China Energy Portal | 中国能源门户. 2021-01-22 [2021-05-19]. (原始内容存档于2021-10-24) (英语).
- ^ 2019 detailed electricity statistics (update of Jan 2021). China Energy Portal | 中国能源门户. 2021-01-20 [2021-05-19]. (原始内容存档于2022-03-31) (英语).
- ^ including biomass
- ^ excluding biomass
- ^ 规划与统计. 中国电力企业联合会. [2018-09-02]. (原始内容存档于2020-11-18).
- ^ Renewables – Global Energy Review 2020 – Analysis. IEA. [2021-01-06]. (原始内容存档于2022-04-21) (英国英语).
- ^ International Hydropower Association. Country Profile - China. International Hydropower Association - IHA. (原始内容存档于6 January 2021).
- ^ Stanway, Muyu Xu, David. China doubles new renewable capacity in 2020; still builds thermal plants. Reuters. 2021-01-21 [2021-03-11]. (原始内容存档于2022-05-11) (英语).
- ^ China reports installing record 72GW of new wind capacity in 2020. Institute for Energy Economics & Financial Analysis. 2021-01-20 [2021-03-11]. (原始内容存档于2021-12-16) (美国英语).
- ^ GLOBAL WIND REPORT 2022 (PDF). GWEC. GWEC. [2022-07-16]. (原始内容存档 (PDF)于2022-04-04).
- ^ Gang, Wu. Wind Matters: China's Role in the Future of Wind (PDF). Goldwind. 2015-10-28 [2016-02-08]. (原始内容 (PDF)存档于2017-01-04).
- ^ China's new wind power capacity hits record high. Xinhua News. [2016-02-08]. (原始内容存档于2016-02-03).
- ^ China leads global increase in wind power generation patents. energydigital.com. 2023-01-18 [2023-02-12]. (原始内容存档于2023-06-08) (英语).
- ^ Oceans of Opportunity: Harnessing Europe's largest domestic energy resource (页面存档备份,存于互联网档案馆) pp. 18-19.
- ^ Wind provides 1.5% of China's electricity (页面存档备份,存于互联网档案馆) Wind Power Monthly, 5 December 2011
- ^ China leads global increase in wind power generation patents. energydigital.com. 2023-01-18 [2023-02-12]. (原始内容存档于2023-06-08) (英语).
- ^ Maguire, Gavin; Maguire, Gavin. Column: China widens renewable energy supply lead with wind power push. Reuters. 2023-03-01 [2023-03-01]. (原始内容存档于2023-05-10) (英语).
- ^ Li, Binlin; Haneklaus, Nils. The role of renewable energy, fossil fuel consumption, urbanization and economic growth on CO2 emissions in China. Energy Reports. 2021 International Conference on Energy Engineering and Power Systems. 2021-11-01, 7: 783–791 [2023-01-24]. ISSN 2352-4847. doi:10.1016/j.egyr.2021.09.194. (原始内容存档于2023-01-24) (英语).
- ^ Borenstein, Seth. China's Carbon Emissions Directly Linked to Rise In Daily Temperature Spikes, Study Finds. The Huffingtion Post. 12 April 2013 [15 May 2013]. (原始内容存档于6 March 2016).
- ^ 38.0 38.1 Statistical Review of World Energy | Energy economics | Home. bp global. [2022-08-24]. (原始内容存档于2015-10-12) (英语).
- ^ 西伯利亚力量天然气管线全线贯通. [2023-01-24]. (原始内容存档于2022-12-22).
- ^ Reuters. Putin oversees launch of Siberian gas field feeding pipeline to China. Reuters. 2022-12-21 [2022-12-28]. (原始内容存档于2023-02-01) (英语).
- ^ 中国找外援解"电荒" 俄罗斯对华输电量翻倍-侨报网. www.uschinapress.com. [2022-08-25]. (原始内容存档于2022-08-25).
- ^ China: installed power generation capacity 2021. Statista. [2022-08-24]. (原始内容存档于2023-01-24) (英语).
- ^ China's installed capacity of renewable energy expands in Jan-Nov. www.news.cn. [2022-08-24]. (原始内容存档于2023-01-24).
- ^ Jianxiang, Yang; Shan, Gao. Analysis: China adds to UHV network to transfer surplus wind energy. www.windpowermonthly.com. [2021-05-15].
- ^ 45.0 45.1 The Challenges and Promises of Greening China's Economy. Belfer Center for Science and International Affairs. [2021-05-15]. (原始内容存档于2023-01-24) (英语).
- ^ 中國特高壓輸電「獨步全球」 實現超遠距離高效能輸電 | 超級工程 | 中國科技. 当代中国. [2023-01-24]. (原始内容存档于2023-01-24).
- ^ Dong, Jie-fang; Wang, Qiang; Deng, Chun; Wang, Xing-min; Zhang, Xiao-lei. How to Move China toward a Green-Energy Economy: From a Sector Perspective. Sustainability. April 2016, 8 (4): 337. doi:10.3390/su8040337 (英语).
- ^ Maguire, Gavin; Maguire, Gavin. Column: China widens renewable energy supply lead with wind power push. Reuters. 2023-03-01 [2023-03-01]. (原始内容存档于2023-05-10) (英语).