|
|
冰川消融,又称冰川后退,是指冰川因冰的融化及蒸发,进而导致冰川长度缩短甚至消失的现象,由于冰川大量消融的时期与大气中温室气体大量增加的时间点接近,因此常做为地球正在经历暖化的证据之一。冰川消融衍生的影响包括淡水供应不足、不利农业灌溉、生态环境改变及海平面上升。[1][2]
在小冰期(1550年~1850年)期间,世界平均气温下降,冰川增长;进入20世纪后,世界各地的冰川开始缩短,对于山谷冰川的研究显示该现象与19世纪后期以来全球气温上升相关。[3][4]1950年至1980年间,由于气温下降,部分冰川消融速度减缓甚至开始增长。自1980年以来,由于全球暖化的加速与加剧,冰川消融变得愈来愈快速且普遍。部分冰川已经完全消失,而余下冰川也饱受威胁。作为部分地区(如喜马拉雅山区及安地斯山脉)主要的供水来源之一及可能引发的海平面上升,冰川消融对山区及沿海地区居民生活具有潜在影响。
冰川质量平衡
编辑.png)

冰川质量平衡是冰川成长的关键。如果堆积区内冰的堆积量超过因融化或在消融区损失的冰量内冰川将会前进,反之则会退缩。消融中的冰川会达到负冰川质量平衡直到达到新的平衡。 冰川质量平衡对冰川十分重要。[5] 气候变迁导致温度与降雪异常,而如果温度持续提升或降雪量减少,冰川将达到负质量平衡:冰川会消融,直到达到平衡;如果温度持续降低或降雪量增加,冰川则会达到正质量平衡:冰川会增长,持续到达到平衡为止。目前大部分的冰川皆达到负质量平衡并持续消融中。[6]
冰川的消融导致低海拔地区的冰川消失。由于高海拔地区气温较低,低海拔地区冰川的消失减少了整体消融,进而使冰川有机会重新平衡。[7][8]
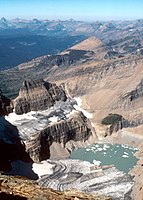
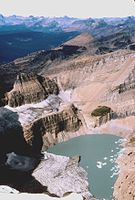
测量消融的方法包括在冰川末缘定桩、全球定位测绘、航空测绘及激光高度计。[9] 负质量平衡的征兆是冰川的长度变短,这显示堆积区缩小了。而堆积区的缩小意味着不只冰川变短,堆积区极有可能开始分裂,最后将导致冰川消失。[10] 例如美国华盛顿州的伊斯顿冰川的长度虽然将可能缩短到只剩一半,但消融的速度正在慢慢减缓。然而美国蒙大拿州的格林纳尔冰川却逐渐萎缩,直至消失。两者之间不同之处在于伊斯顿冰川的顶部持续有降雪,而格林纳尔冰川的顶部已裸露,加速消融速度。
中纬度的冰川
编辑中纬度的冰川位于北回归线与北极圈之间或南回归线与南极圈之间。在这范围中的冰川,冰源主要来自山岳冰川、山谷冰川甚至是冰帽,因此主要位于高山地区。[11] 世界上所有的中纬度冰川皆位于山脉上,如:亚洲的喜马拉雅山脉;欧洲的阿尔卑斯山脉、比利牛斯山脉;北美洲的洛矶山脉、太平洋海岸山脉;南美洲的安地斯山脉以及新西兰的山区。[12] 在这区域中,冰川比低纬地区更常见,且愈靠近极圈数量及规模也愈大。事实上,在过去150年中,中纬地区的冰川是被研究最多的。目前所有中纬度的冰川都处于负质量平衡的状态中。
北半球—欧亚大陆
编辑
欧洲
编辑在法国,该国所有六个主要冰川都处于消融状态。阿尔卑斯山的最高峰白朗峰的阿让蒂耶尔冰川,自1870年来已经消融了1,150米(3,770英尺)。[13]其他白朗峰上的冰川也消融许多,如该国最大的冰川冰海冰川(长12公里(7.5英里)),在1994年至2008年间从消融了500米(1,600英尺) [14][15] ,而若从小冰期算起则已消融了2,300米(7,500英尺)。
研究人员发现,阿尔卑斯山的冰川似乎比几十年前消融得更快。苏黎世大学2009年发表的一篇论文中,自1973年以来对89个瑞士冰川的调查,发现有76个消融,5个静止,8个开始向前增长。特里夫特冰川在2003年至2005年间经历了最大的消融:350米(1,150英尺)。阿莱奇冰川是瑞士最大的冰川,而从1880年至2009年,阿莱奇冰川消融了2.8公里(1.7英里)。消融速率自1980年以来也有所增加,在过去20%的时间内消融了全部长度的30%(800米(2,600英尺))。

莫特瑞许冰川是最早开始研究的冰川之一,自1878年开始测量长度。从1878年至1998年共消融了2公里(1.2英里),每年平均消融17米(56英尺)。但在1999年至2005年间消融的速度明显增加,每年平均消融30米(98英尺)。同样地,意大利的冰川中,只有约三分之一在1980年代消融。然而到了1999年,89%的冰川都开始消融。2005年时,该国的冰川委员会发现伦巴底的123条冰川正在消融。[16] 一项对意大利阿尔卑斯山的斯芙泽利纳冰川进行的随机研究显示,2002年至2006年的消融速度远高于过去35年。[17] 为了研究位于伦巴底高山地区的冰川,研究人员对从20世纪50年代到21世纪初拍摄的一系列空中和地面图像进行了比较,并推断出在1954年至2003年间大部分较小的冰川失去了一半以上的长度。[18] [19]
尽管阿尔卑斯山的冰川受到冰川学家的关注比欧洲其他地区更多,但研究显示北欧的冰川也在退缩。自第二次世界大战结束以来,塔尔法拉研究站对瑞典的大冰川进行了世界上为期最长的质量平衡研究。在瑞典北部的凯布讷山脉,1990年至2001年间对其中16条冰川的研究发现,有14条正在消融,1条正在增长,1条静止。[20]挪威自19世纪初开始进行冰川研究,自20世纪90年代以来定期进行有系统的调查。因为内陆冰川的质量平衡通常是负的,因此在20世纪90年代,海洋冰川显示出正向的质量平衡并增长。[21] 海洋冰川的增长有部分可归因于1989年至1995年间的大雪。 然而,后来降雪量的减少导致大多数挪威冰川大幅度地消融。 如2010年对31个挪威冰川进行的调查显示,27条正在消融,1条静止,3条增长。

挪威的恩加布里恩冰川是斯瓦蒂森冰帽的入海冰川之一,在20世纪时有增长,但它在1999年至2014年间退缩了56米(184英尺)[22] 布林达尔冰川在2000年至2014年之间消融了56米(184英尺),而自小冰期结束以来已消融2公里(1.2英里)的兰贝丝黛丝可卡冰川在1997年至2007年间消融了200米(660英尺)。[23]布里克斯达尔冰川在1996年至2004年间消融了230米(750英尺),而光在2004年中就消融了130米(430英尺);这是这条冰川自1900年以来最大幅度的消融。[24] 这个数字在2006年超过了其他4条冰川:珍达尔冰川、布林达尔冰川、布利斯达尔冰川及巴格塞冰川(皆为约斯特冰帽的入海冰川)2005年秋季至2006年秋季,4条冰川消融了超过100米(330英尺)。[25]总结来说,从1999年至2005年,该冰川(布里克斯达尔冰川)消融了336米(1,102英尺)。
在西班牙的比利牛斯山脉,最近的研究显示,在1981年至2005年期间,马拉德塔山的冰川范围和体积都有重大损失。 其中包括面积减少35.7%,从2.41平方公里(600英亩)减少到1.55平方公里(380英亩),总冰量减少0.0137平方公里(0.0033立方英里),冰川终点平均海拔高度增加 43.5米(143英尺)。[26] 自1991年以来,整个比利牛斯山脉的冰川面积已经减少了50至60%。在此期间,巴莱图冰川、佩尔迪格罗冰川及和拉摩尼亚冰川已经完全消失。佩尔迪多冰川从90公顷缩小到40公顷。[27]
自1850年以来,阿尔卑斯山的冰川消融,根本原因是可以确定由工业黑碳引起的冰川反照率下降。 根据一份报告,这可能加速了欧洲冰川的退缩,否则这些冰川可能会继续扩大到大约1910年。[28]
西伯利亚和俄罗斯远东地区
编辑西伯利亚通常被归类为极地地区。由于冬季干燥,仅在阿尔泰山脉、上扬斯克山脉、切尔斯基山脉和孙塔尔哈亚塔山脉中有冰川,加上贝加尔湖附近的一些非常小的冰川。 由于贝加尔湖地区的冰川从未受到研究,自1989年以来可能已经完全消失。[29][30][31] 在1952年至2006年间,阿克图盆地地区的冰川减少了7.2%。 这种收缩的趋势主要发生在冰川的消融区。 根据2006年的一份报告,阿尔泰地区在过去的120年中平均温度上升了摄氏1.2℃,其中大部分都是自20世纪末以来的增长。
在俄罗斯远东地区,由于堪察加半岛冬季有来自阿留申低压的湿气,因此冰川数目较西伯利亚多。截至2010年,冰川总面积约为906平方公里(350平方英里),已知有448个冰川。[32] 而在千岛群岛南部和库页岛,尽管冬季降雪量很大,但在夏季气温凉爽的情况下降雨量较高。即使是在该地区最高峰洛帕丁山,融化速度也过快,无法获得正质量平衡。 在楚科奇半岛,小型高山冰川数量众多,但比堪察加的冰川范围要小得多,总面积约为300平方公里(120平方英里)。
关于西伯利亚和俄罗斯远东地区的冰川消融的资料不如世界上大多数其他冰川地区充足。造成这种情况的原因有几个,主要原因是1989年共产主义倒台以来,监测站的数量大幅减少。引用错误:<ref>标签中未填内容的引用必须填写name属性另一个因素是在20世纪40年代以前人们认为上扬斯克山脉和切尔斯基山脉不存在冰川,以及虽早已预测有冰川存在,但极度偏远的堪察加半岛及楚科奇自治区。不过对它们的研究仍可追溯至第二次世界大战结束。引用错误:<ref>标签中未填内容的引用必须填写name属性 尽管如此,除了堪察加半岛的火山冰川外,现有的记录确实显示阿尔泰山脉所有冰川的全面消融。萨哈的冰川总面积达70平方公里,自1945年以来已经缩减了约28%,在一些地方每年达到几个百分点,而在阿尔泰和楚科特山以及堪察加半岛的非火山地区,消融幅度相当大。引用错误:<ref>标签中未填内容的引用必须填写name属性
喜马拉雅山和中亚
编辑
喜马拉雅山脉和中亚其他山脉维持着大型冰川。在喜马拉雅山脉中,估计有15,000条冰川,是兴都库什山脉、喀喇昆仑山脉以及天山山脉的冰川数量的两倍。这地区也是极地以外最大的冰川区域。[33] 这些冰川为蒙古、中国西部、巴基斯坦、阿富汗和印度等干旱地区提供了重要的水源。与世界上其他的冰川一样,喜马拉雅地区的冰川都处于负质量平衡。研究指出,从20世纪70年代初到21世纪初,冰的质量减少了9%。[34] 温度的变化导致了冰川湖的形成以及膨胀,这可能导致冰川湖突发洪水(GLOFs)数量与几率增加。如果照目前的趋势持续下去,冰的质量将逐渐减少,并将影响供水。[35]
在阿富汗的瓦罕走廊,30个冰川中有28个在1976年至2003年之间大幅度地消融,平均每年消融11米(36英尺)。[36] 其中,泽曼斯坦冰川在此期间消融了460米(1,510英尺),约占其长5.2公里(3.2英里)的10%。[37]在1950年至1970年间,中国的612个冰川时有53%的冰川正在消融。 1990年以后,95%的冰川被测量出来正在消融,显示冰川的消融变得更加普遍。 [38]喜马拉雅山地区的冰川都处于消融之中。珠穆朗玛峰北侧流向西藏的绒布冰川每年消融20米(66英尺)。在尼泊尔的坤布地区,沿着喜马拉雅山脉的前缘的15条冰川都有显著的消融,平均每年消融28米(92英尺)。 [39] 其中最著名的是坤布冰川,从1976年到2007年,以每年18米(59英尺)的速度消融。 其他的案例还有印度的根戈德里冰川,它在1936年至1996年间消融了1,147米(3,763英尺),却在倒数25年中发生了850米(2,790英尺)的消融。[40][41] 然而,冰川仍然超过30公里(19英里)长。 在锡金邦的26条冰川,从1976年至2005年间以每年平均13.02米(42.7英尺)的速度消融。[42] 总体而言,大喜马拉雅地区的冰川平均每年退缩18至20米(59至66英尺)。[43] 大喜马拉雅地区唯一可以看到冰川增长的区域是喀喇昆仑山脉,而且只有在最高海拔的冰川,但这可能是因为降水量增加,冰川末端因压力下滑,并使冰川进一步累积冰雪。在1997年和2001年之间,长达68公里(42英里)的比亚佛冰川在中段增厚了10到25米(33到82英尺),但它没有增长。[44]
随着喜马拉雅山脉冰川的退缩,已经形成了许多冰川湖泊。 而令人担忧的是,研究人员估计位于尼泊尔和不丹的45条冰川有发生冰川湖突发洪水的潜在风险。[45] 一个确定具有潜在危险性的冰川湖是不丹的拉非斯特朗错,其长度为1.6公里(0.99英里),宽度为0.96公里(0.6英里),深度为80米(260英尺)。但到了1995年,湖水已经膨胀到长1.94公里(1.21英里),宽1.13公里(0.70英里),深107米(351英尺)。 [46] 1994年,拉非斯特朗错附近的卢吉错的洪水造成23人死亡。[47]
吉尔吉斯的阿希拉克山脉的冰川在1943年至1977年间经历了轻微的消融,并在1977年至2001年间加速消融了其剩余质量的20%。[48] 而吉尔吉斯、哈萨克及中国共同拥有的天山山脉,在1955年至2000年间每年消融近2平方公里(0.48立方英里)的冰,而这是提供当地水源的主要来源。牛津大学的研究报告指出,在1974年至1990年期间,平均每条冰川消融本身质量的1.28% 。[49]
塔吉克的帕米尔高原约有八千个冰川,其中大部分都处于消融状态。[50] 在20世纪,塔吉克的冰川损失了20平方公里(4.8立方英里)的冰。 长达70公里(43英里)的费德先科冰川是塔吉克最大的冰川(同时也是地球上最大的非大陆冰川),在1933年至2006年间消融了1公里(0.62英里),但在1966年至2000年期间则消融了44平方公里(17平方英里) 。帕米尔高原地区在干旱季节高度依赖冰川融水,而冰川持续消融将导致水量短期增加,但长期来看,流入河流和溪流的冰川融水将减少。[51]
北半球—北美洲
编辑
北美洲的冰川主要位于落基山脉及太平洋海岸山脉的山脊上,除了少数残留在内华达山脉中的冰川。(不论格陵兰岛) 除了少数像塔库冰川这样的入海冰川,几乎所有北美洲的冰川都处于消融状态。 自1980年左右以来,速度迅速增加,而且从那以后的每十年以来总体上都比前一次有更快的退缩速率。 [52][53]
喀斯喀特山脉
编辑喀斯喀特山脉位于北美洲的西部,北起加拿大的不列颠哥伦比亚省南部,南至加利福尼亚州北部。 除了阿拉斯加外,美国约有一半的冰川位于加拿大—美国边境和华盛顿州中部的I-90之间。 这些冰川含有大量的水,约有870,000立方米(1,140,000立方英尺)。
[54]


在1975年,由于平均气温降低和1944年至1976年间降水增加,许多北喀斯喀特的冰川都有所增长。但到了1987年,北喀斯喀特冰川开始消融,而且每年消融的速度愈来愈快。1984年至2005年间,北喀斯喀特的冰川平均厚度减少了12.5米(41英尺),体积减少了20-40%。
研究北喀斯喀特冰川的冰川学家发现,所有受监测的冰川都正在消融;而自1985年以来,蜘蛛冰川、刘易斯冰川、牛奶湖冰川和大卫冰川已完全消失。白查克冰川(格拉西尔峰附近)是一个著名的例子。冰川面积从1958年的3.1平方公里(1.2平方英里)缩小到2002年的0.9平方公里(0.35平方英里)。1850年至1950年间,贝克山东南侧的博尔德冰川消融了2,700米(8,700英尺)。美国国家森林局观察到因为1953年天气较凉且潮湿,冰川开始增长。至1979年截止,共增长了743米(2,438英尺)。[55] 但冰川自1987年至2005年,消融了450米(1,480英尺)留下了贫瘠的土地。这次消融发生的原因是因为冬季降雪减少、夏季气温升高。在北喀斯喀特地区,冬季积雪量自1946年以来下降了25%,同期夏季气温上升了0.7°C(1.2°F)。截至2005年,67%的北喀斯喀特冰川处于负平衡状态,无法在目前的气候条件下保留下来。除非气温下降,积雪量增加,否则这些冰川最终会消失。[56]
洛矶山脉(美国)
编辑在蒙大拿州的冰川国家公园,冰川数量迅速减少。几十年来,美国国家公园管理局和美国地质调查局绘制了每条冰川的面积。将19世纪中期的照片与当代图像进行比较,可以充分证明自1850年以来冰河已经大量消融。航空测绘图显示,就连像格林纳尔冰川的冰川都在消融。 与1850年首次调查时比较,大部分冰川都已经消融到原尺寸的三分之一,而且许多小冰川已完全消失。1850年被冰川覆盖的区域中,(99平方公里(38平方英里))只有27%在1993年被覆盖。[57] 研究人员认为到了2030年,冰川国家公园的绝大多数冰川将会消失,除非气候变迁立即停止。[58]
-
 1938年 T.J.Hileman 国民生产总值
 -
 1981年, 卡尔键(USGS)
 -
 1998年 丹Fagre(USGS)
 -
 2009年, 本格森林赛(USGS)


怀俄明州的气候虽然较为干旱,但仍然能够支撑大提顿国家公园内的几十条小冰川,这些冰川在过去50年内都有显著的退缩。教室冰川位于公园西南部,是公园内较易前往的冰川之一,预计到2025年消失。在1950年至1999年的研究显示,温德河山脉的布里杰-蒂顿国家森林和肖松尼国家森林的冰川规模在同期间缩小了三分之一以上。照片显示,今天的冰川只有18世纪90年代末拍摄时的一半。研究还显示,20世纪90年代冰川退缩的比例大于过去100年中的每个年代。 干内冰川位于干内峰东北坡,是洛矶山脉最大的冰川。根据研究,自1920年以来,它已经消融了超过50%的质量,其中近一半的消融发生自1980年以来。[59]
Canadian Rockies and Coast and Columbia Mountains
编辑
In the Canadian Rockies, glaciers are generally larger and more widespread than to the south in the Rocky Mountains. One of the more accessible in the Canadian Rockies is the Athabasca Glacier, which is an outlet glacier of the 325 km2(125 sq mi) Columbia Icefield. The Athabasca Glacier has retreated 1,500米(4,900英尺) since the late 19th century. Its rate of retreat has increased since 1980, following a period of slow retreat from 1950 to 1980. The Peyto Glacier in Alberta covers an area of about 12 km2(4.6 sq mi), and retreated rapidly during the first half of the 20th century, stabilized by 1966, and resumed shrinking in 1976.[61] The Illecillewaet Glacier in British Columbia's Glacier National Park (Canada), part of the Selkirk Mountains (west of the Rockies) has retreated 2 km(1.2 mi) since first photographed in 1887.
In Garibaldi Provincial Park in Southwestern British Columbia over 505 km2(195 sq mi), or 26%, of the park, was covered by glacier ice at the beginning of the 18th century. Ice cover decreased to 297 km2(115 sq mi) by 1987–1988 and to 245 km2(95 sq mi) by 2005, 50% of the 1850 area. The 50 km2(19 sq mi) loss in the last 20 years coincides with negative mass balance in the region. During this period all nine glaciers examined have retreated significantly.[62]
Alaska
编辑

There are thousands of glaciers in Alaska but only few have been named. The Columbia Glacier near Valdez in Prince William Sound has retreated 15 km(9.3 mi) in the last 25 years. Its calved icebergs partially caused the Exxon Valdez oil spill, when the tanker changed course to avoid the ice tips. The Valdez Glacier is in the same area, and though it does not calve, has also retreated significantly. "A 2005 aerial survey of Alaskan coastal glaciers identified more than a dozen glaciers, many former tidewater and calving glaciers, including Grand Plateau, Alsek, Bear, and Excelsior Glaciers that are rapidly retreating. Of 2,000 glaciers observed, 99% are retreating."[60] Icy Bay in Alaska is fed by three large glaciers—Guyot, Yahtse, and Tyndall Glaciers—all of which have experienced a loss in length and thickness and, consequently, a loss in area. Tyndall Glacier became separated from the retreating Guyot Glacier in the 1960s and has retreated 24 km(15 mi) since, averaging more than 500米(1,600英尺) per year.[63]
The Juneau Icefield Research Program has monitored outlet glaciers of the Juneau Icefield since 1946. On the west side of the ice field, the terminus of the Mendenhall Glacier, which flows into suburban Juneau, Alaska, has retreated 580米(1,900英尺). Of the nineteen glaciers of the Juneau Icefield, eighteen are retreating, and one, the Taku Glacier, is advancing. Eleven of the glaciers have retreated more than 1 km(0.62 mi) since 1948 — Antler Glacier, 5.4 km(3.4 mi); Gilkey Glacier, 3.5 km(2.2 mi); Norris Glacier, 1.1 km(0.68 mi) and Lemon Creek Glacier, 1.5 km(0.93 mi).[64] Taku Glacier has been advancing since at least 1890, when naturalist John Muir observed a large iceberg calving front. By 1948 the adjacent fjord had filled in, and the glacier no longer calved and was able to continue its advance. By 2005 the glacier was only 1.5 km(0.93 mi) from reaching Taku Point and blocking Taku Inlet. The advance of Taku Glacier averaged 17米(56英尺) per year between 1988 and 2005. The mass balance was very positive for the 1946–88 period fueling the advance; however, since 1988 the mass balance has been slightly negative, which should in the future slow the advance of this mighty glacier.[65]
Long-term mass balance records from Lemon Creek Glacier in Alaska show slightly declining mass balance with time.[66] The mean annual balance for this glacier was −0.23米(0.75英尺) each year during the period of 1957 to 1976. Mean annual balance has been increasingly negatively averaging −1.04米(3.4英尺) per year from 1990 to 2005. Repeat glacier altimetry, or altitude measuring, for 67 Alaska glaciers find rates of thinning have increased by more than a factor of two when comparing the periods from 1950 to 1995 (0.7米(2.3英尺) per year) and 1995 to 2001 (1.8米(5.9英尺) per year).[67] This is a systemic trend with loss in mass equating to loss in thickness, which leads to increasing retreat—the glaciers are not only retreating, but they are also becoming much thinner. In Denali National Park, all glaciers monitored are retreating, with an average retreat of 20米(66英尺) per year. The terminus of the Toklat Glacier has been retreating 26米(85英尺) per year and the Muldrow Glacier has thinned 20米(66英尺) since 1979.[68] Well documented in Alaska are surging glaciers that have been known to rapidly advance, even as much as 100米(330英尺) per day. Variegated, Black Rapids, Muldrow, Susitna and Yanert are examples of surging glaciers in Alaska that have made rapid advances in the past. These glaciers are all retreating overall, punctuated by short periods of advance.
Southern hemisphere
编辑Andes and Tierra del Fuego
编辑
A large region of population surrounding the central and southern Andes of Argentina and Chile reside in arid areas that are dependent on water supplies from melting glaciers. The water from the glaciers also supplies rivers that have in some cases been dammed for hydroelectric power. Some researchers believe that by 2030, many of the large ice caps on the highest Andes will be gone if current climate trends continue. In Patagonia on the southern tip of the continent, the large ice caps have retreated a 1 km(0.62 mi) since the early 1990s and 10 km(6.2 mi) since the late 19th century. It has also been observed that Patagonian glaciers are receding at a faster rate than in any other world region.[69] The Northern Patagonian Ice Field lost 93 km2(36 sq mi) of glacier area during the years between 1945 and 1975, and 174 km2(67 sq mi) from 1975 to 1996, which indicates that the rate of retreat is increasing. This represents a loss of 8% of the ice field, with all glaciers experiencing significant retreat. The Southern Patagonian Ice Field has exhibited a general trend of retreat on 42 glaciers, while four glaciers were in equilibrium and two advanced during the years between 1944 and 1986. The largest retreat was on O'Higgins Glacier, which during the period 1896–1995 retreated 14.6 km(9.1 mi). The Perito Moreno Glacier is 30 km(19 mi) long and is a major outflow glacier of the Patagonian ice sheet, as well as the most visited glacier in Patagonia. Perito Moreno Glacier is in equilibrium, but has undergone frequent oscillations in the period 1947–96, with a net gain of 4.1 km(2.5 mi). This glacier has advanced since 1947, and has been essentially stable since 1992. Perito Moreno Glacier is one of three glaciers in Patagonia known to have advanced, compared to several hundred others in retreat.[70] The two major glaciers of the Southern Patagonia Icefield to the north of Moreno, Upsala and Viedma Glacier have retreated 4.6 km(2.9 mi) in 21 years and 1 km(0.62 mi) in 13 years respectively.[71] In the Aconcagua River Basin, glacier retreat has resulted in a 20% loss in glacier area, declining from 151 km2(58 sq mi) to 121 km2(47 sq mi).[72] The Marinelli Glacier in Tierra del Fuego has been in retreat since at least 1960 through 2008.
Oceania
编辑
In New Zealand, mountain glaciers have been in general retreat since 1890, with an acceleration since 1920. Most have measurably thinned and reduced in size, and the snow accumulation zones have risen in elevation as the 20th century progressed. Between 1971–75 Ivory Glacier receded 30米(98英尺) from the glacial terminus, and about 26% of its surface area was lost. Since 1980 numerous small glacial lakes formed behind the new terminal moraines of several of these glaciers. Glaciers such as Classen, Godley and Douglas now all have new glacial lakes below their terminal locations due to the glacial retreat over the past 20 years. Satellite imagery indicates that these lakes are continuing to expand. There has been significant and ongoing ice volume losses on the largest New Zealand glaciers, including the Tasman, Ivory, Classen, Mueller, Maud, Hooker, Grey, Godley, Ramsay, Murchison, Therma, Volta and Douglas Glaciers. The retreat of these glaciers has been marked by expanding proglacial lakes and terminus region thinning. The loss in Southern Alps total ice volume from 1976–2014 is 34 percent of the total.[73]
Several glaciers, notably the much-visited Fox and Franz Josef Glaciers on New Zealand's West Coast, have periodically advanced, especially during the 1990s, but the scale of these advances is small when compared to 20th-century retreat. Both are more than 2.5 km(1.6 mi) shorter than a century ago. These large, rapidly flowing glaciers situated on steep slopes have been very reactive to small mass-balance changes. A few years of conditions favorable to glacier advance, such as more westerly winds and a resulting increase in snowfall, are rapidly echoed in a corresponding advance, followed by equally rapid retreat when those favorable conditions end.[74] The glaciers that have been advancing in a few locations in New Zealand have been doing so due to transient local weather conditions, which have brought more precipitation and cloudier, cooler summers since 2002.[75]
相关条目
编辑- 世界冰川列表
- 全球暖化效应
- 极端冰调查
- 后冰川的反弹
参考资料
编辑- ^ Intergovernmental Panel on Climate Change. Graph of 20 glaciers in retreat worldwide. Climate Change 2001 (Working Group I: The Scientific Basis). [February 14, 2015].
- ^ Thomas Mölg. Worldwide glacier retreat. RealClimate. [February 14, 2015].
- ^ Intergovernmental panel on climate change. 2.2.5.4 Mountain glaciers. Climate Change 2001 (Working Group I: The Scientific Basis. [February 14, 2015]. (原始内容存档于September 1, 2014).
- ^ National Snow and Ice Data Center. Global glacier recession. GLIMS Data at NSIDC. [February 14, 2015]. (原始内容存档于July 5, 2008).
- ^ Mote, Philip W.; Kaser, Georg. The Shrinking Glaciers of Kilimanjaro: Can Global Warming Be Blamed?. American Scientist. 2007, 95 (4): 318–325. doi:10.1511/2007.66.318.
- ^ Alex S. Gardner; Geir Moholdt; J. Graham Cogley; Bert Wouters; Anthony A. Arendt; John Wahr; Etienne Berthier; Regine Hock; W. Tad Pfeffer; Georg Kaser; Stefan R. M. Ligtenberg; Tobias Bolch; Martin J. Sharp; Jon Ove Hagen; Michiel R. van den Broeke; Frank Paul. A Reconciled Estimate of Glacier Contributions to Sea Level Rise: 2003 to 2009. Science. May 17, 2013, 340 (6134): 852–857. Bibcode:2013Sci...340..852G. PMID 23687045. doi:10.1126/science.1234532.
- ^ Hubbard, Bryn; Neil F. Glasser. Field Techniques in Glaciology and Glacial Geomorphology. Wiley. May 20, 2005: 179–198. ISBN 978-0470844274.
- ^ Pelto, M.S. Forecasting temperate alpine glacier survival from accumulation zone observations (PDF). The Cryosphere. 2010, 4 (1): 67–75. doi:10.5194/tc-4-67-2010.
- ^ Clark, Peter U. Abrupt Climate Change: Final Report, Synthesis and Assessment Product. DIANE Publishing Company. September 28, 2009: 39–45. ISBN 9781437915693.
- ^ Pelto, Mauri S. The Disequilibrium of North Cascade, Washington Glaciers 1984–2004. In Hydrologic Processes. [February 17, 2015].
- ^ Schultz, Jürgen. The Ecozones of the World: The Ecological Divisions of the Geosphere 2. Springer. September 7, 2005. ISBN 978-3540200147.
- ^ Hensen, Robert. The Rough Guide to Climate Change. DK. October 30, 2006. ISBN 9781843537113.
- ^ White, Christopher. The Melting World: A Journey Across America's Vanishing Glaciers. St. Martin's Press. September 3, 2013: 133. ISBN 978-0312546281.
- ^ Fort, Monique. Landscapes and Landforms in France. Springer Netherlands. 2014: 172. ISBN 9789400770218.
- ^ Pelto, Mauri. Mer de Glace, Glacier Retreat-A Receding Sea. From a Glacier's Perspective. April 4, 2010 [March 1, 2015].
- ^ Malinverni, Eva; Croci, Claudia; Sgroi, Fabrizio. Glacier Monitoring by Remote Sensing and GIS Techniques in Open Source Environment (pdf). EARSeL eProceedings. February 2008 [April 18, 2015].
- ^ Cannone, Nicoletta; Diolaiuti, G; Guglielmin, M; Smiraglia, C. Accelerating Climate Change Impacts on Alpine Glacier Forefield Ecosystems in the European Alps (PDF). Ecological Applications. 2008, 18 (3): 637–648 [April 18, 2015]. PMID 18488623. doi:10.1890/07-1188.1. (原始内容 (PDF)存档于April 18, 2015).
- ^ Diolaiuti, Guglielmina; Maragno, D.; d'Agata, C.; Smiraglia, C.; Bocchiola, D. Glacier retreat and climate change: Documenting the last 50 years of Alpine glacier history from area and geometry changes of Dosdè Piazzi glaciers (Lombardy Alps, Italy). Progress in Physical Geography. April 2011, 35 (2): 161–182 [April 18, 2015]. doi:10.1177/0309133311399494.
- ^ Glaciers Online. Swiss Education. [April 18, 2015].
- ^ Wikland, Maria; Holmlund, Per. Swedish Glacier front monitoring program – compilation of data from 1990 to 2001 (pdf). Stockholm: Tarfala Research Station, University of Stockholm: 37–40. 2002 [June 28, 2015].
- ^ Nesje, Atle; Bakke, Jostein; Dahl, Svein Olaf; Lie, Øyvind; Matthews, John A. Norwegian mountain glaciers in the past, present and future (pdf). Global and Planetary Change. 2008, 60: 10–27. Bibcode:2008GPC....60...10N. doi:10.1016/j.gloplacha.2006.08.004.
- ^ Engabreen. Norwegian Water Resources and Energy Directorate. September 16, 2014 [May 25, 2015].
- ^ Hardangerjøkulen. Norwegian Water Resources and Energy Directorate. September 16, 2014 [May 25, 2015]. (原始内容存档于May 26, 2015).
- ^ Nesje, Atle. Briksdalsbreen in western Norway: AD 1900–2004 frontal fluctuations as a combined effect of variations in winter precipitation and summer temperature. The Holocene. December 2005, 15 (8): 1245–1252 [May 25, 2015]. doi:10.1191/0959683605hl897rr.
- ^ Nussbaumer, Samuel U.; Nesje, Atle; Zumbühl, Heinz J. Historical glacier fluctuations of Jostedalsbreen and Folgefonna (southern Norway) reassessed by new pictorial and written evidence. The Holocene (Sage). May 2011, 21 (3): 455–471 [May 25, 2015]. doi:10.1177/0959683610385728.
- ^ J. Chuecaia; et al. Recent evolution (1981–2005) of the Maladeta glaciers, Pyrenees, Spain: extent and volume losses and their relation with climatic and topographic factors. Journal of Glaciology. 2007, 53 (183): 547–557. Bibcode:2007JGlac..53..547C. doi:10.3189/002214307784409342.CS1 maint: Explicit use of et al. (link)
- ^ Serrano, E., E. Martinez and F. Lampre. Desaparición de Glaciares Pirenaicos Españoles. 2004 [July 1, 2015].CS1 maint: Multiple names: authors list (link)
- ^ Painter, Thomas; Flanner, Mark; Kaser, Georg; Marzeion, Ben; VanCuren, Richard; Abdalati, Waleed. End of the Little Ice Age in the Alps forced by industrial black carbon. Proceedings of the National Academy of Sciences. September 17, 2013, 110 (88): 15216–15221 [July 1, 2015]. doi:10.1073/.pnas.1302570110.
- ^ Surazakov, A.B.; Aizem, V.B.; Aizem, E.M.; Nikitin, S.A. Glacier Changes in the Siberian Altai Mountains, Ob river basin, (1952–2006) estimated with high resolution imagery (PDF). Environmental Research Letters (IOP): 045017. [July 6, 2015]. Bibcode:2007ERL.....2d5017S. doi:10.1088/1748-9326/2/4/045017.
- ^ Dyurgerov, Mark B.; Meier, Mark F. Glaciers and the Changing Earth System: A 2004 Snapshot (PDF). University of Colorado. 2005 [July 6, 2015].
- ^ Ananicheva, M.D.; Krenke, A.N.; Barry, R.G. The Northeast Asia mountain glaciers in the near future by AOGCM scenarios (PDF). The Cryosphere. October 6, 2010, 4: 435–445 [July 21, 2015]. Bibcode:2010TCry....4..435A. doi:10.5194/tc-4-435-2010.
- ^ Jones, Vivienne; Solomina, Olga. The geography of Kamchatka. Global and Planetary Change. June 6, 2015, 134 (132): 3–9 [July 21, 2015]. Bibcode:2015GPC...134....3J. doi:10.1016/j.gloplacha.2015.06.003.
- ^ Himalayas Facts. Nature. February 11, 2011 [August 26, 2015].
- ^ Laghari, Javaid. Climate change: Melting glaciers bring energy uncertainty. Nature. November 11, 2013 [November 15, 2015].
- ^ Narrowing the Knowledge Gap on Glaciers in High Mountain Asia. International Symposium on Glaciology in High Mountain Asia. International Centre for Integrated Mountain Development. March 9, 2015 [August 26, 2015].
- ^ Haritashya, Umesh K.; Bishop, Michael P.; Shroder, John F.; Bush, Andrew B. G.; Bulley, Henry N. N. Space-based assessment of glacier fluctuations in the Wakhan Pamir, Afghanistan (PDF). Climate Change. 2009, 94 (1–2): 5–18. doi:10.1007/s10584-009-9555-9.
- ^ Pelto, Mauri. Zemestan Glacier, Afghanistan Retreats. American Geophysical UNion. December 23, 2009 [November 15, 2015].
- ^ Sandeep Chamling Rai; Trishna Gurung; et alia. An Overview of Glaciers, Glacier Retreat and Subsequent Impacts in Nepal, India and China (PDF). WWF Nepal Program. [November 15, 2015].
- ^ Bajracharya, Mool. Glaciers, glacial lakes and glacial lake outburst floods in the Mount Everest region, Nepal (pdf). International Centre for Integrated Mountain Development. [January 10, 2010].
- ^ Naithani, Ajay K.; Nainwal, H. C.; Sati, K. K.; Prasad, C. Geomorphological evidences of retreat of the Gangotri Glacier and its characteristics (PDF). Current Science. 2001, 80 (1): 87–94 [November 15, 2015].
- ^ Retreat of the Gangotri Glacier. NASA Earth Observatory. June 23, 2004 [November 15, 2015].
- ^ Raina, V. K. Himalayan Glaciers A State-of-Art Review of Glacial Studies, Glacial Retreat and Climate Change (PDF). Ministry of Environment and Forests. 2010 [November 15, 2015].
- ^ Anthwal, Ashish; Joshi, Varun; Sharma, Archana; Anthwal, Smriti. Retreat of Himalayan Glaciers – Indicator of Climate Change (PDF). Nature and Science. 2006, 4 (4): 53–59 [November 16, 2015].
- ^ Hewitt, Kenneth. [0332:TKAGEA2.0.CO;2 The Karakoram Anomaly? Glacier Expansion and the ‘Elevation Effect,’ Karakoram Himalaya]. Mountain Research and Development (International Mountain Society). 2006, 25 (4): 332–340 [November 16, 2015]. doi:10.1659/0276-4741(2005)025[0332:tkagea]2.0.co;2.
- ^ Glacial Lakes and Glacial Lake Outburst Floods in Nepal (pdf). International Centre for Integrated Mountain Development: 31. 2011 [November 22, 2015].
- ^ Qader Mirza, M. Monirul. Climate Change and Water Resources in South Asia. Taylor & Francis Ltd. July 13, 2005: 143 [November 22, 2015]. ISBN 978-0203020777.
- ^ United Nations Environment Programme. Global Warming Triggers Glacial Lakes Flood Threat – April 16, 2002. UNEP News Release 2002/20. [November 22, 2015].
- ^ T. E. Khromova, M. B. Dyurgerov and R. G. Barry. Late-twentieth century changes in glacier extent in the Ak-shirak Range, Central Asia, determined from historical data and ASTER imagery (Abstract). American Geophysical Union. 2003, 30 (16): 1863. Bibcode:2003GeoRL..30.1863K. doi:10.1029/2003gl017233.
- ^ Kirby, Alex. Kazakhstan's glaciers 'melting fast'. BBC News. September 4, 2003.
- ^ Kayumov, A. Glaciers Resources of Tajikistan in Condition of the Climate Change (pdf). State Agency for Hydrometeorology of Committee for Environmental Protection under the Government of the Republic of Tajikistan. [January 31, 2016].
- ^ Novikov, V. Tajikistan 2002, State of the Environment Report. Climate Change. Research Laboratory for Nature Protection (Tajikistan). [January 31, 2016].
- ^ Huegel, Tony. Sierra Nevada Byways: 51 of the Sierra Nevada's Best Backcountry Drives (Backcountry Byways). Wilderness Press. 2008: 2 [2011-10-15]. ISBN 0-89997-473-2.
- ^ Castor, Stephen B.; Keith G, Papke, Richard O. Meeuwig. Proceedings of the 39th Forum on the Geology of Industrial Minerals, Nevada. Nevada Bureau of Mines and Geology. 2004: 192 [2011-10-15].CS1 maint: Multiple names: authors list (link)
- ^ Pelto, Mauri S. Recent Global Glacier Retreat Overview. [2011-10-15].
- ^ Mauri S. Pelto; Cliff Hedlund. Terminus behavior and response time of North Cascade glaciers, Washington, U.S.A. Journal of Glaciology. 2001, 47 (158): 497–506. Bibcode:2001JGlac..47..497P. doi:10.3189/172756501781832098.
- ^ Mauri S. Pelto. North Cascade Glacier Terminus Behavior. Nichols College. [August 7, 2016].
- ^ U.S. Geological Survey. Glacier Monitoring in Glacier National Park. [April 25, 2003]. (原始内容存档于February 18, 2013).
- ^ U.S. Geological Survey, U.S. Department of the Interior. Glacier Retreat in Glacier National Park, Montana. [April 25, 2003].
- ^ Wyoming Water Resources Data System Library. Glacial Icemelt in the Wind River Range, Wyoming. July 11, 1990.
- ^ 60.0 60.1 引用错误:没有为名为
pelto5的参考文献提供内容 - ^ Canadian Cryospheric Information Network. Past Variability of Canadian Glaciers. [February 14, 2006].
- ^ J. Koch, B. Menounos & J. Clague. Glacier change in Garibaldi Provincial Park, southern Coast Mountains, British Columbia, since the Little Ice Age. Global and Planetary Change. 66. 2009,. (3–4) 161–178 (3–4): 161–178. Bibcode:2009GPC....66..161K. doi:10.1016/j.gloplacha.2008.11.006.
- ^ Bruce F. Molnia. Fast-flow advance and parallel rapid retreat of non-surging tidewater glaciers in Icy Bay and Yakutat Bay, Alaska 1888–2003. [September 6, 2003].
- ^ Mauri S. Pelto & Maynard M. Miller. Terminus Behavior of Juneau Icefield Glaciers 1948–2005. North Cascade Glacier Climate Project. [August 7, 2016].
- ^ Mauri S. Pelto et al. The equilibrium flow and mass balance of the Taku Glacier, Alaska 1950–2006 (PDF). The Cryosphere. 2008, 2 (2): 147–157. doi:10.5194/tc-2-147-2008.
- ^ Maynard M. Miller; Mauri S. Pelto. Mass Balance Measurements of the Lemon Creek Glacier, Juneau Icefield, Alaska, 1953–2005. [August 7, 2016]. (原始内容存档于August 13, 2016). 已忽略未知参数
|df=(帮助) - ^ Anthony A. Arendt; et al. Rapid Wastage of Alaska Glaciers and Their Contribution to Rising Sea Level. Science. July 19, 2002, 297 (5580): 382–386. Bibcode:2002Sci...297..382A. PMID 12130781. doi:10.1126/science.1072497.
- ^ Guy W. Adema; et al. Melting Denali: Effects of Climate Change on the Glaciers of Denali National Park and Preserve (PDF). [September 9, 2007].
- ^ Patagonian ice in rapid retreat. BBC News. April 27, 2000.
- ^ Skvarca, P. & R. Naruse. Dynamic behavior of glaciar Perito Moreno, Southern Patagonia. Annals of Glaciology. 1997, 24 (1): 268–271. Bibcode:1996AnGla..24..268S. doi:10.1017/S0260305500012283.
Casassa, G., H. Brecher, A. Rivera and M. Aniya. A century-long record of glacier O'Higgins, Patagonia. Annals of Glaciology. 1997, 24 (1): 106–110. doi:10.1017/S0260305500012015. - ^ EORC. Huge glaciers retreat on a large scale in Patagonia, South America. Earth Observation research Center. July 15, 2005 [June 13, 2009].
- ^ Brown, F., Rivera, A., Acuna, C.; Rivera; Acuña. Recent glaciers variations at the Aconcagua Basin, central Chilean Andes (PDF). Annals of Glaciology. 2008, 48 (2): 43–48. Bibcode:2008AnGla..48...43B. doi:10.3189/172756408784700572.
- ^ Salinger, Jim; Fitzharris, Blair; Chinn, Trevor, New Zealand's Southern Alps have lost a third of their ice, The Conversation, July 29, 2014 [February 18, 2015]
- ^ United States Department of the Interior. Glaciers of New Zealand. May 4, 2000.
- ^ Goodenough, Patrick. A Glacier Grows, Undeterred by Heated Kyoto Debate. Cybercast News Service. July 7, 2008.
[[Category:19世纪]] [[Category:20世纪]] [[Category:21世纪]] [[Category:氣候史]] [[Category:冰川学]] [[Category:山地生態學]]